Figure SPM.6
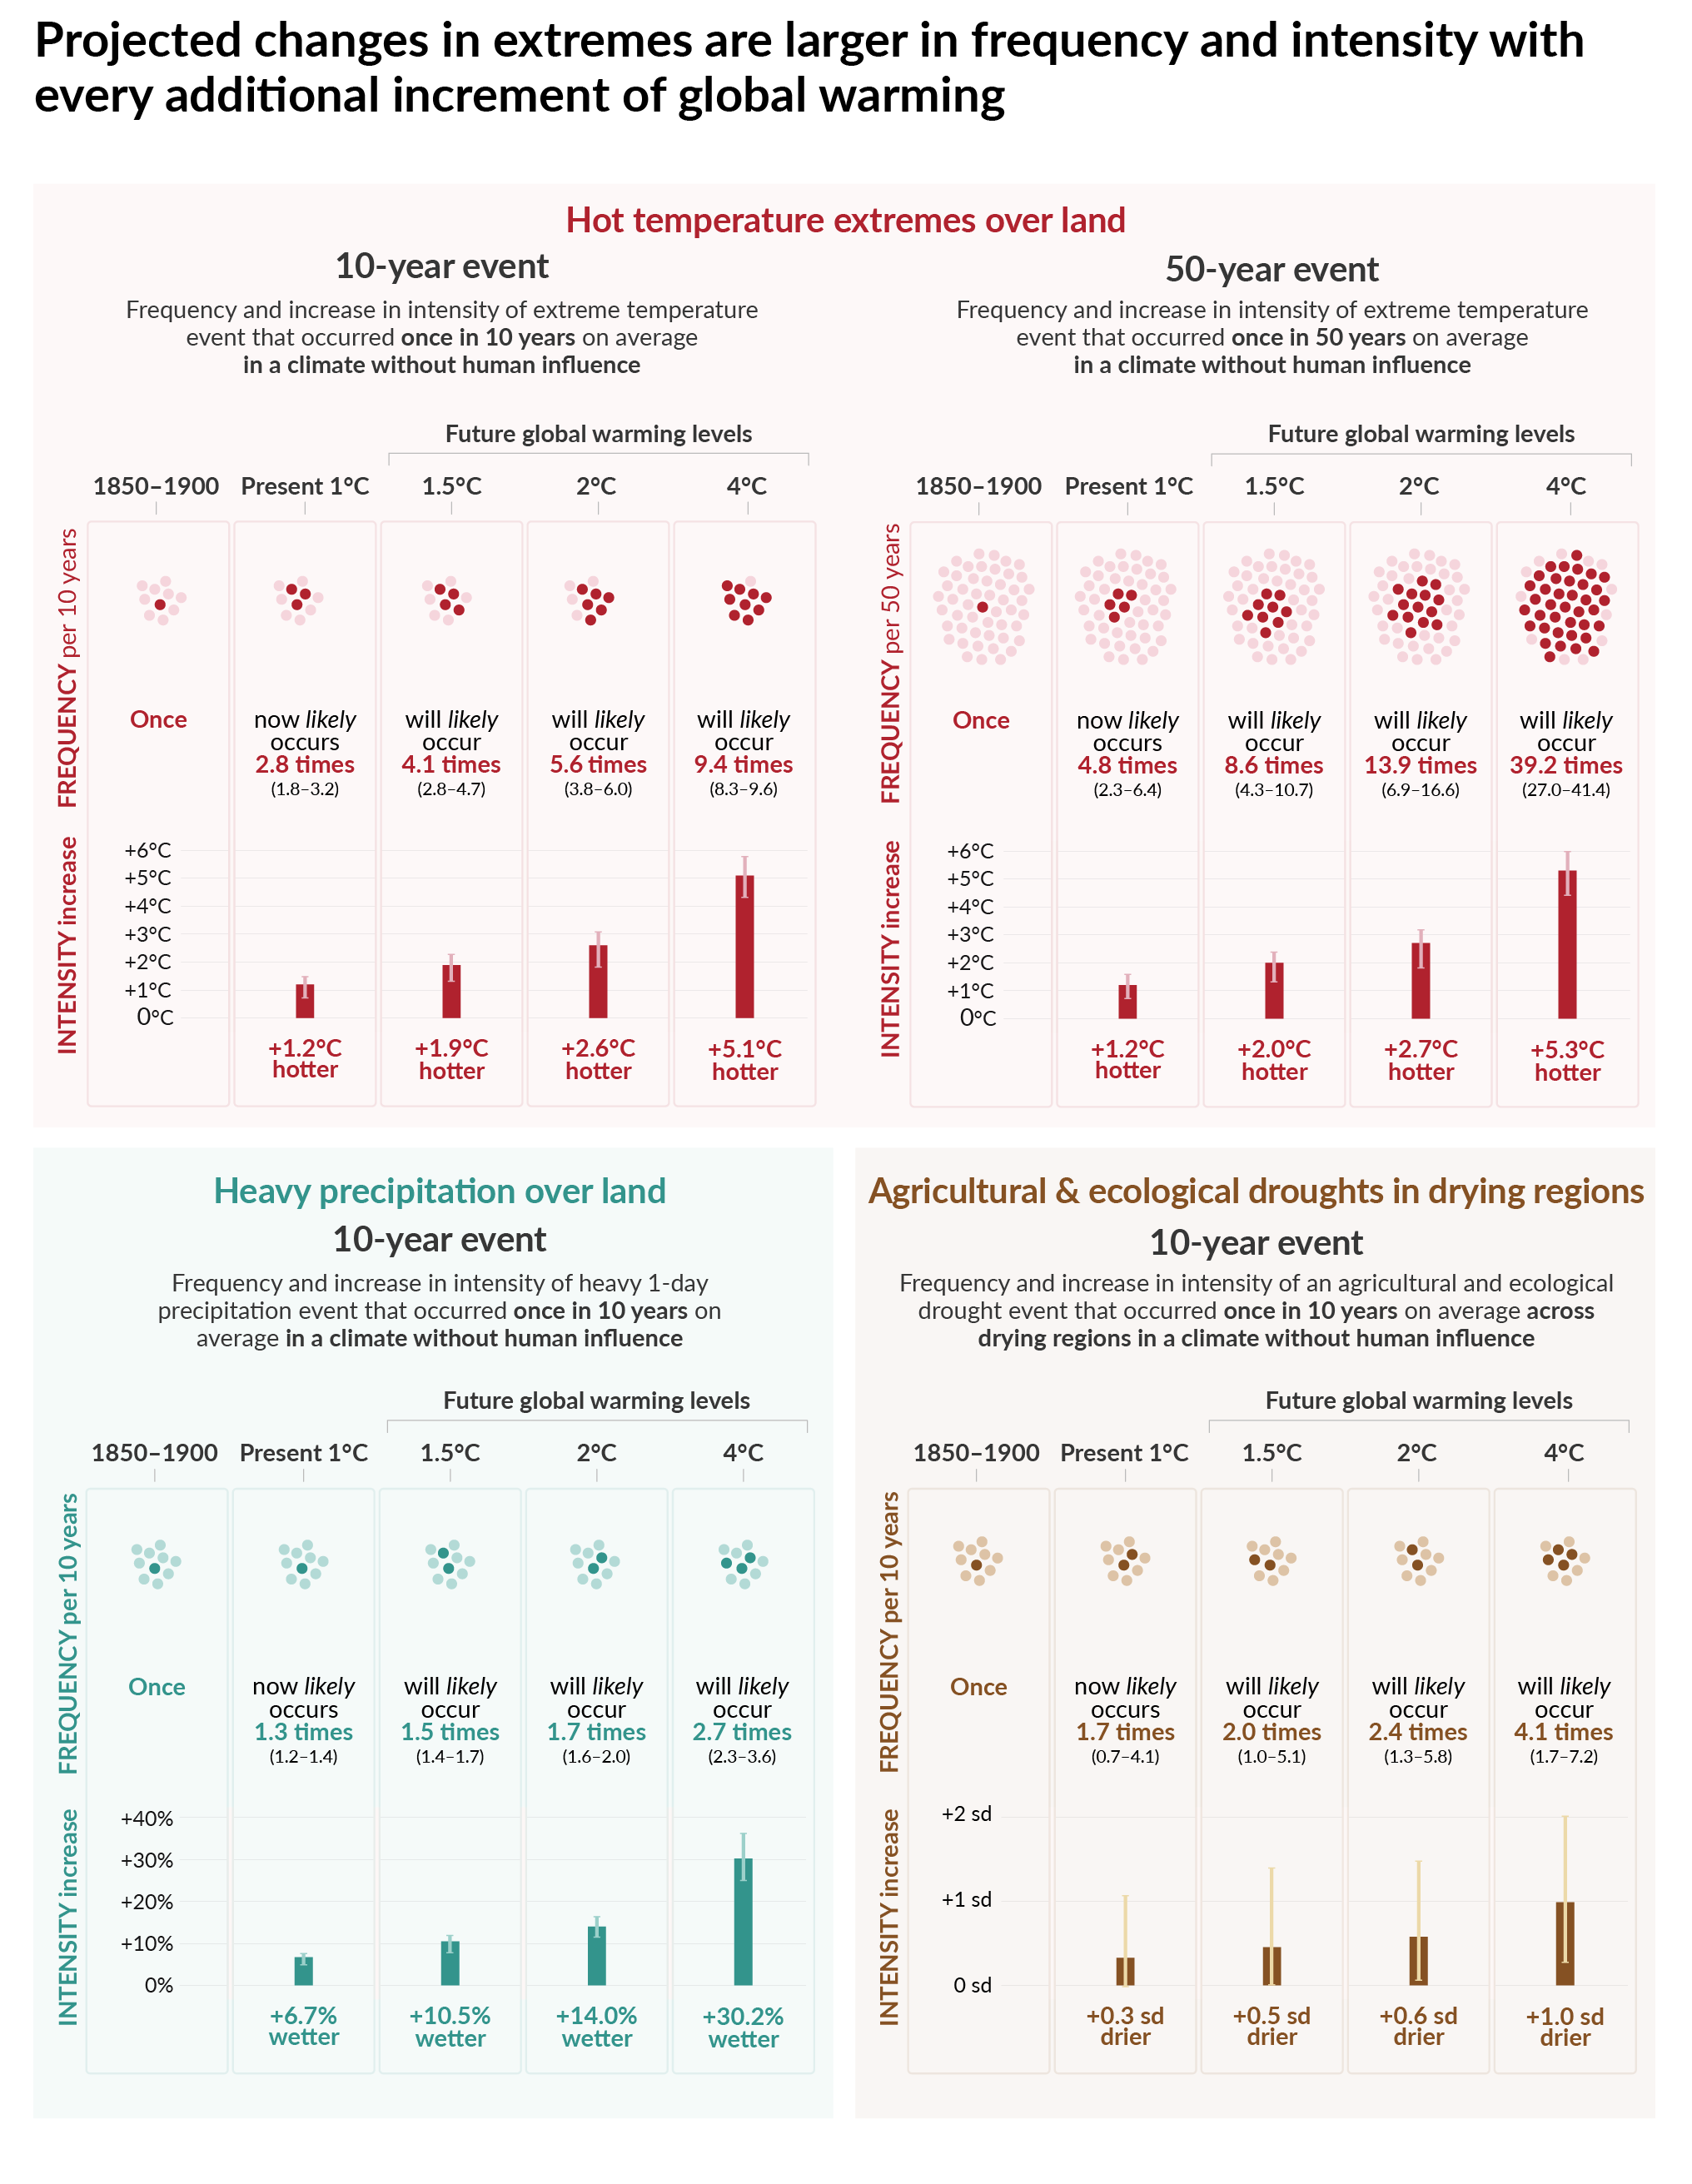
Figure caption
Projected changes are shown at global warming levels of 1°C, 1.5°C, 2°C, and 4°C and are relative to 1850–1900, 9representing a climate without human influence. The figure depicts frequencies and increases in intensity of 10- or 50-year extreme events from the base period (1850–1900) under different global warming levels.
Hot temperature extremes are defined as the daily maximum temperatures over land that were exceeded on average once in a decade (10-year event) or once in 50 years (50-year event) during the 1850–1900 reference period. Extreme precipitation events are defined as the daily precipitation amount over land that was exceeded on average once in a decade during the 1850–1900 reference period. Agricultural and ecological drought events are defined as the annual average of total column soil moisture below the 10th percentile of the 1850–1900 base period. These extremes are defined on model grid box scale. For hot temperature extremes and extreme precipitation, results are shown for the global land. For agricultural and ecological drought, results are shown for drying regions only, which correspond to the AR6 regions in which there is at least medium confidence in a projected increase in agricultural and ecological droughts at the 2°C warming level compared to the 1850–1900 base period in the Coupled Model Intercomparison Project Phase 6 (CMIP6). These regions include Western North America, Central North America, Northern Central America, Southern Central America, Caribbean, Northern South America, North-Eastern South America, South American Monsoon, South-Western South America, Southern South America, Western and Central Europe, Mediterranean, West Southern Africa, East Southern Africa, Madagascar, Eastern Australia, and Southern Australia (Caribbean is not included in the calculation of the figure because of the too-small number of full land grid cells). The non-drying regions do not show an overall increase or decrease in drought severity. Projections of changes in agricultural and ecological droughts in the CMIP Phase 5 (CMIP5) multi-model ensemble differ from those in CMIP6 in some regions, including in parts of Africa and Asia. Assessments of projected changes in meteorological and hydrological droughts are provided in Chapter 11.
In the ‘frequency’ section, each year is represented by a dot. The dark dots indicate years in which the extreme threshold is exceeded, while light dots are years when the threshold is not exceeded. Values correspond to the medians (in bold) and their respective 5–95% range based on the multi-model ensemble from simulations of CMIP6 under different Shared Socio-economic Pathway scenarios. For consistency, the number of dark dots is based on the rounded-up median. In The ‘intensity’ section, medians and their 5–95% range, also based on the multi-model ensemble from simulations of CMIP6, are displayed as dark and light bars, respectively. Changes in the intensity of hot temperature extremes and extreme precipitation are expressed as degree Celsius and percentage. As for agricultural and ecological drought, intensity changes are expressed as fractions of standard deviation of annual soil moisture. {11.1; 11.3; 11.4; 11.6; 11.9; Figures 11.12, 11.15, 11.6, 11.7, and 11.18}