Figure SPM.7
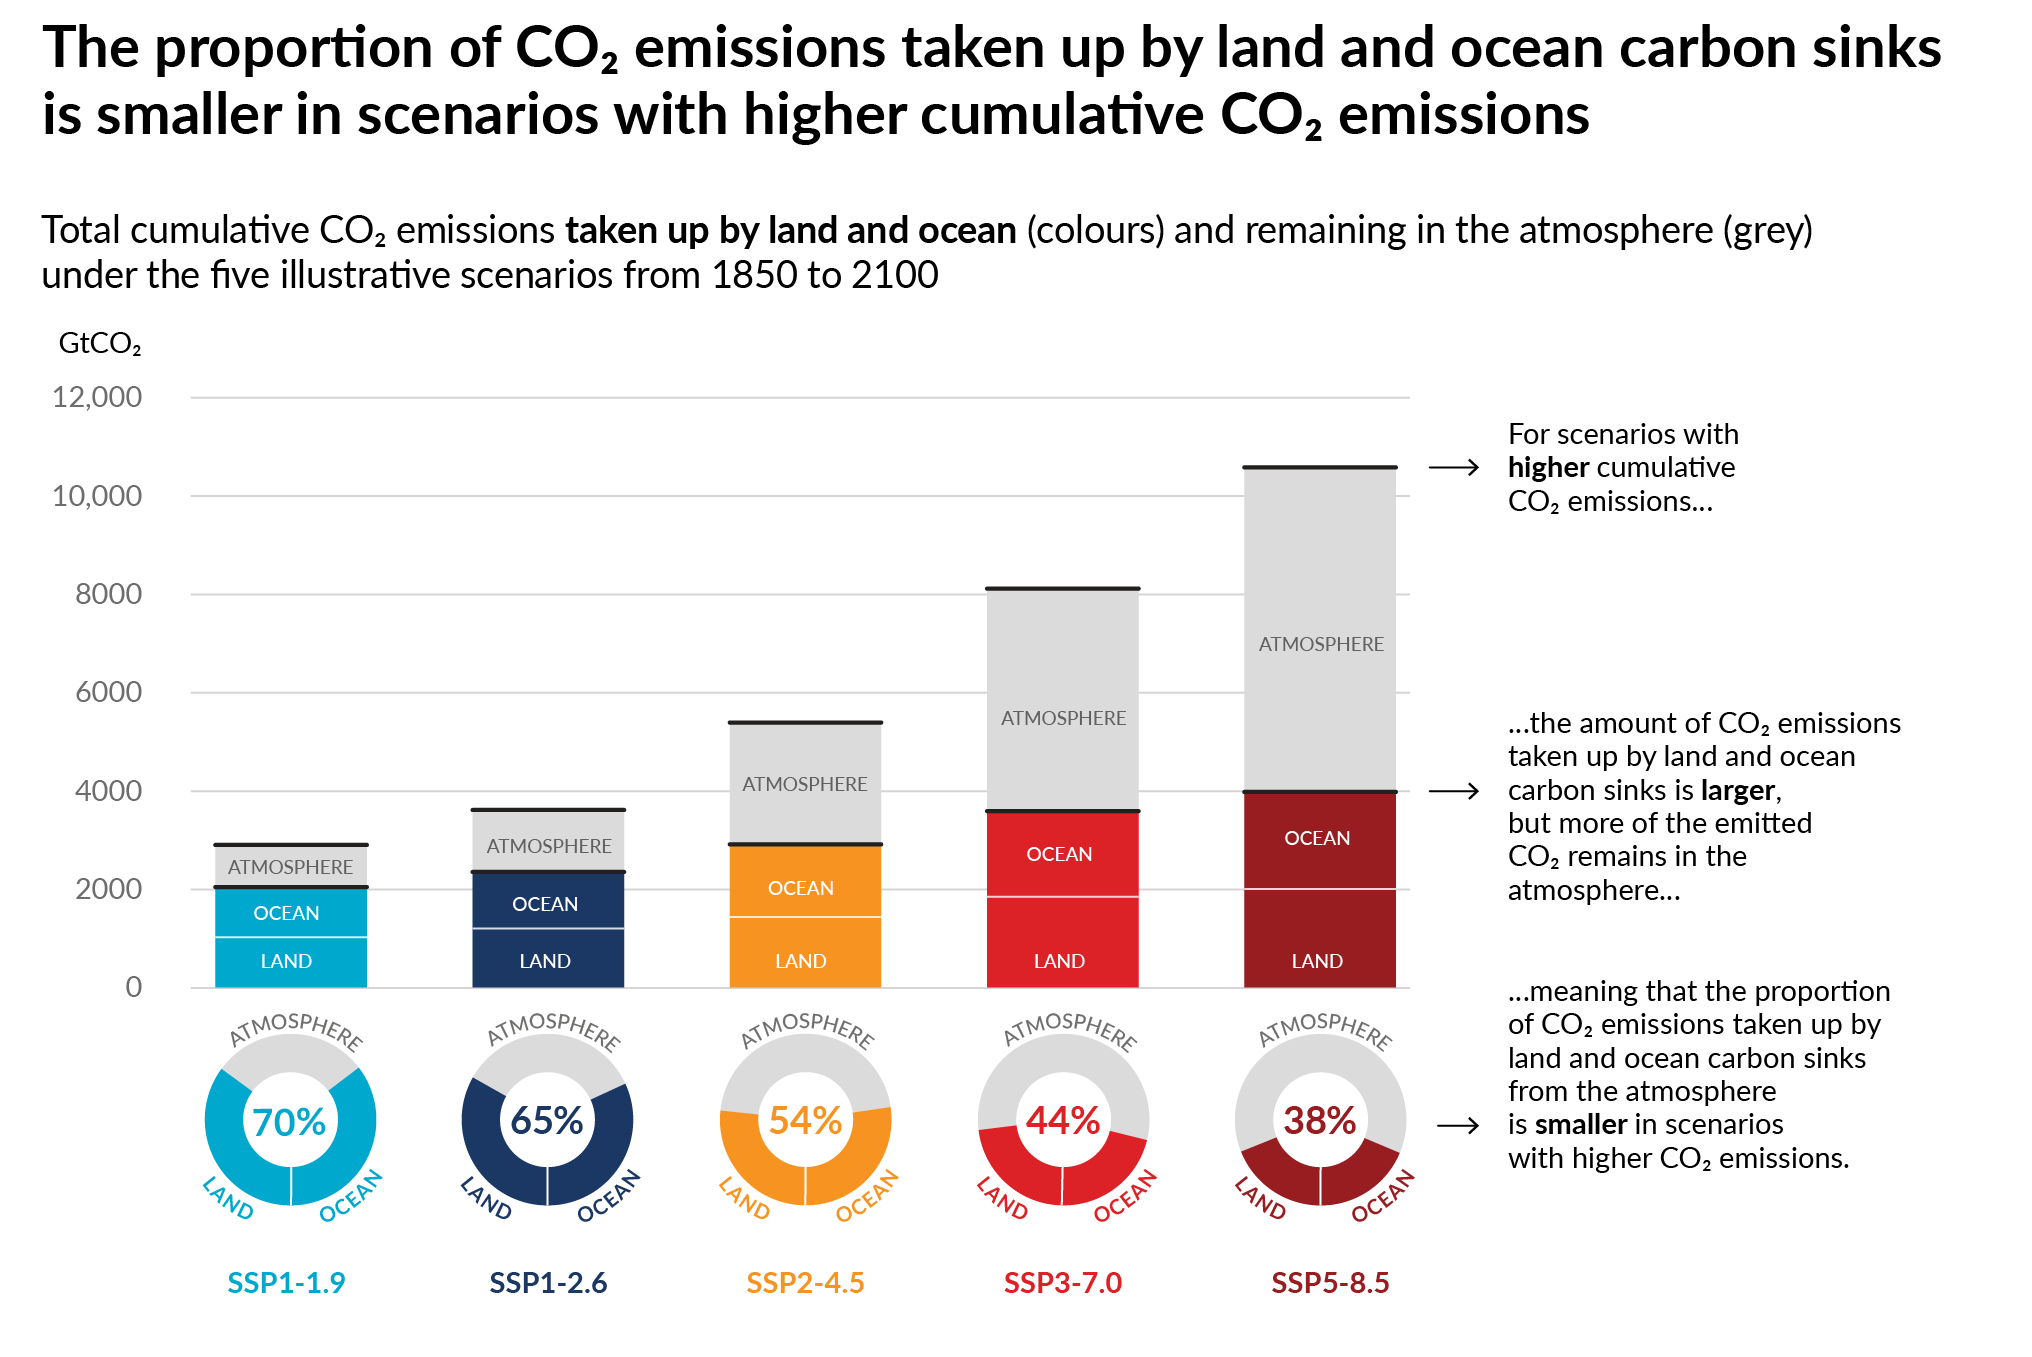
Figure caption
The cumulative anthropogenic (human-caused) carbon dioxide (CO2) emissions taken up by the land and ocean sinks under the five illustrative scenarios (SSP1-1.9, SSP1-2.6, SSP2-4.5, SSP3-7.0 and SSP5-8.5) are simulated from 1850 to 2100 by Coupled Model Intercomparison Project Phase 6 (CMIP6) climate models in the concentration-driven simulations. Land and ocean carbon sinks respond to past, current and future emissions; therefore, cumulative sinks from 1850 to 2100 are presented here. During the historical period (1850–2019) the observed land and ocean sink took up 1430 GtCO2 (59% of the emissions).
The bar chart illustrates the projected amount of cumulative anthropogenic CO2 emissions (GtCO2) between 1850 and 2100 remaining in the atmosphere (grey part) and taken up by the land and ocean (coloured part) in the year 2100. The doughnut chart illustrates the proportion of the cumulative anthropogenic CO2 emissions taken up by the land and ocean sinks and remaining in the atmosphere in the year 2100. Values in % indicate the proportion of the cumulative anthropogenic CO2 emissions taken up by the combined land and ocean sinks in the year 2100. The overall anthropogenic carbon emissions are calculated by adding the net global land-use emissions from the CMIP6 scenario database to the other sectoral emissions calculated from climate model runs with prescribed CO2 concentrations. 33Land and ocean CO2 uptake since 1850 is calculated from the net biome productivity on land, corrected for CO2 losses due to land-use change by adding the land-use change emissions, and net ocean CO2 flux. {5.2.1; Table 5.1; 5.4.5; Figure 5.25; Box TS.5; Box TS.5, Figure 1}