Figure SPM.8
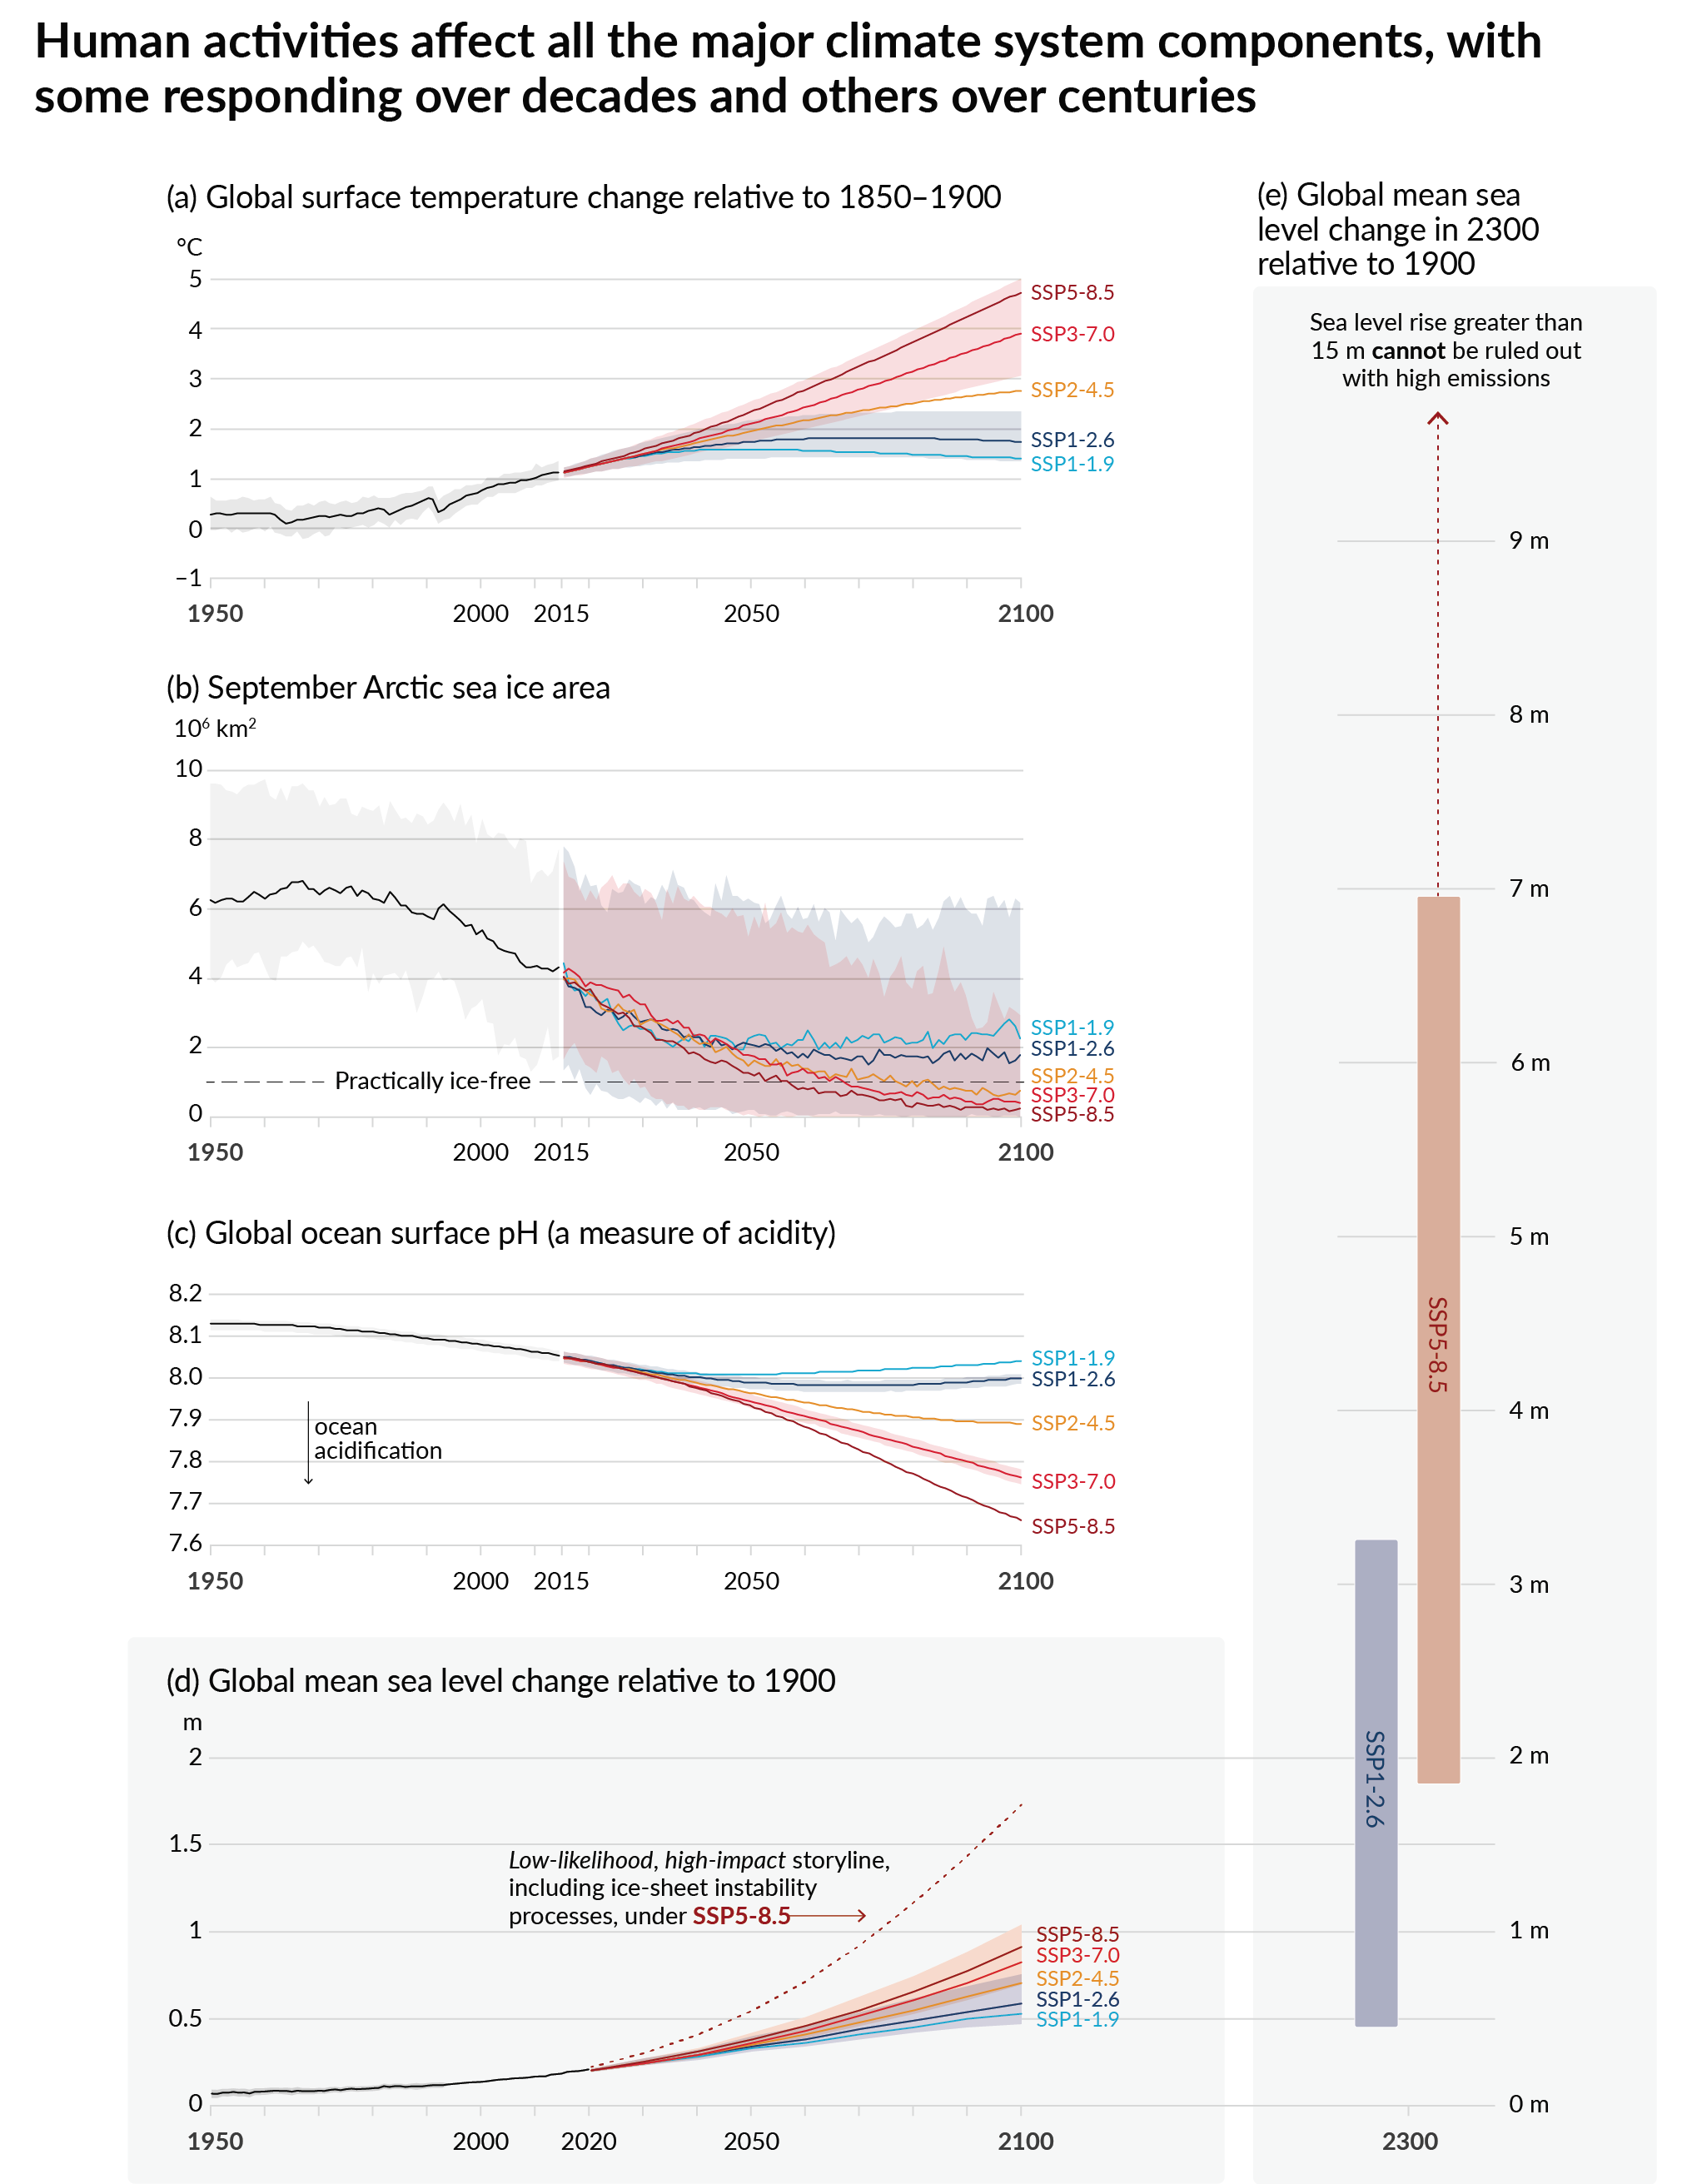
Figure caption
The projections for each of the five scenarios are shown in colour. Shades represent uncertainty ranges – more detail is provided for each panel below. The black curves represent the historical simulations (panels a, b, c) or the observations (panel d). Historical values are included in all graphs to provide context for the projected future changes.
Panel (a) Global surface temperature changes in °C relative to 1850–1900. These changes were obtained by combining Coupled Model Intercomparison Project Phase 6 (CMIP6) model simulations with observational constraints based on past simulated warming, as well as an updated assessment of equilibrium climate sensitivity (see Box SPM.1). Changes relative to 1850–1900 based on 20-year averaging periods are calculated by adding 0.85°C (the observed global surface temperature increase from 1850–1900 to 1995–2014) to simulated changes relative to 1995–2014. Very likely ranges are shown for SSP1-2.6 and SSP3-7.0.
Panel (b) September Arctic sea ice area in 106km2 based on CMIP6 model simulations. Very likely ranges are shown for SSP1-2.6 and SSP3-7.0. The Arctic is projected to be practically ice-free near mid-century under intermediate and high GHG emissions scenarios.
Panel (c) Global ocean surface pH (a measure of acidity) based on CMIP6 model simulations. Very likely ranges are shown for SSP1-2.6 and SSP3-7.0.
Panel (d) Global mean sea level change in metres, relative to 1900. The historical changes are observed (from tide gauges before 1992 and altimeters afterwards), and the future changes are assessed consistently with observational constraints based on emulation of CMIP, ice-sheet, and glacier models. Likely ranges are shown for SSP1-2.6 and SSP3-7.0. Onlylikely ranges are assessed for sea level changes due to difficulties in estimating the distribution of deeply uncertain processes. The dashed curve indicates the potential impact of these deeply uncertain processes. It shows the 83rd percentile of SSP5-8.5 projections that include low-likelihood, high-impact ice-sheet processes that cannot be ruled out; because oflow confidence in projections of these processes, this curve does not constitute part of a likely range. Changes relative to 1900 are calculated by adding 0.158 m (observed global mean sea level rise from 1900 to 1995–2014) to simulated and observed changes relative to 1995–2014.
Panel (e) Global mean sea level change at 2300 in metres relative to 1900. Only SSP1-2.6 and SSP5-8.5 are projected at 2300, as simulations that extend beyond 2100 for the other scenarios are too few for robust results. The 17th–83rd percentile ranges are shaded. The dashed arrow illustrates the 83rd percentile of SSP5-8.5 projections that include low-likelihood, high-impact ice-sheet processes that cannot be ruled out.
Panels (b) and (c) are based on single simulations from each model, and so include a component of internal variability. Panels (a), (d) and (e) are based on long-term averages, and hence the contributions from internal variability are small. {4.3; Figures 4.2, 4.8, 4.11; 9.6; Figure 9.27; Figures TS.8 and TS.11; Box TS.4 Figure 1}