Box TS.10, Figure 1
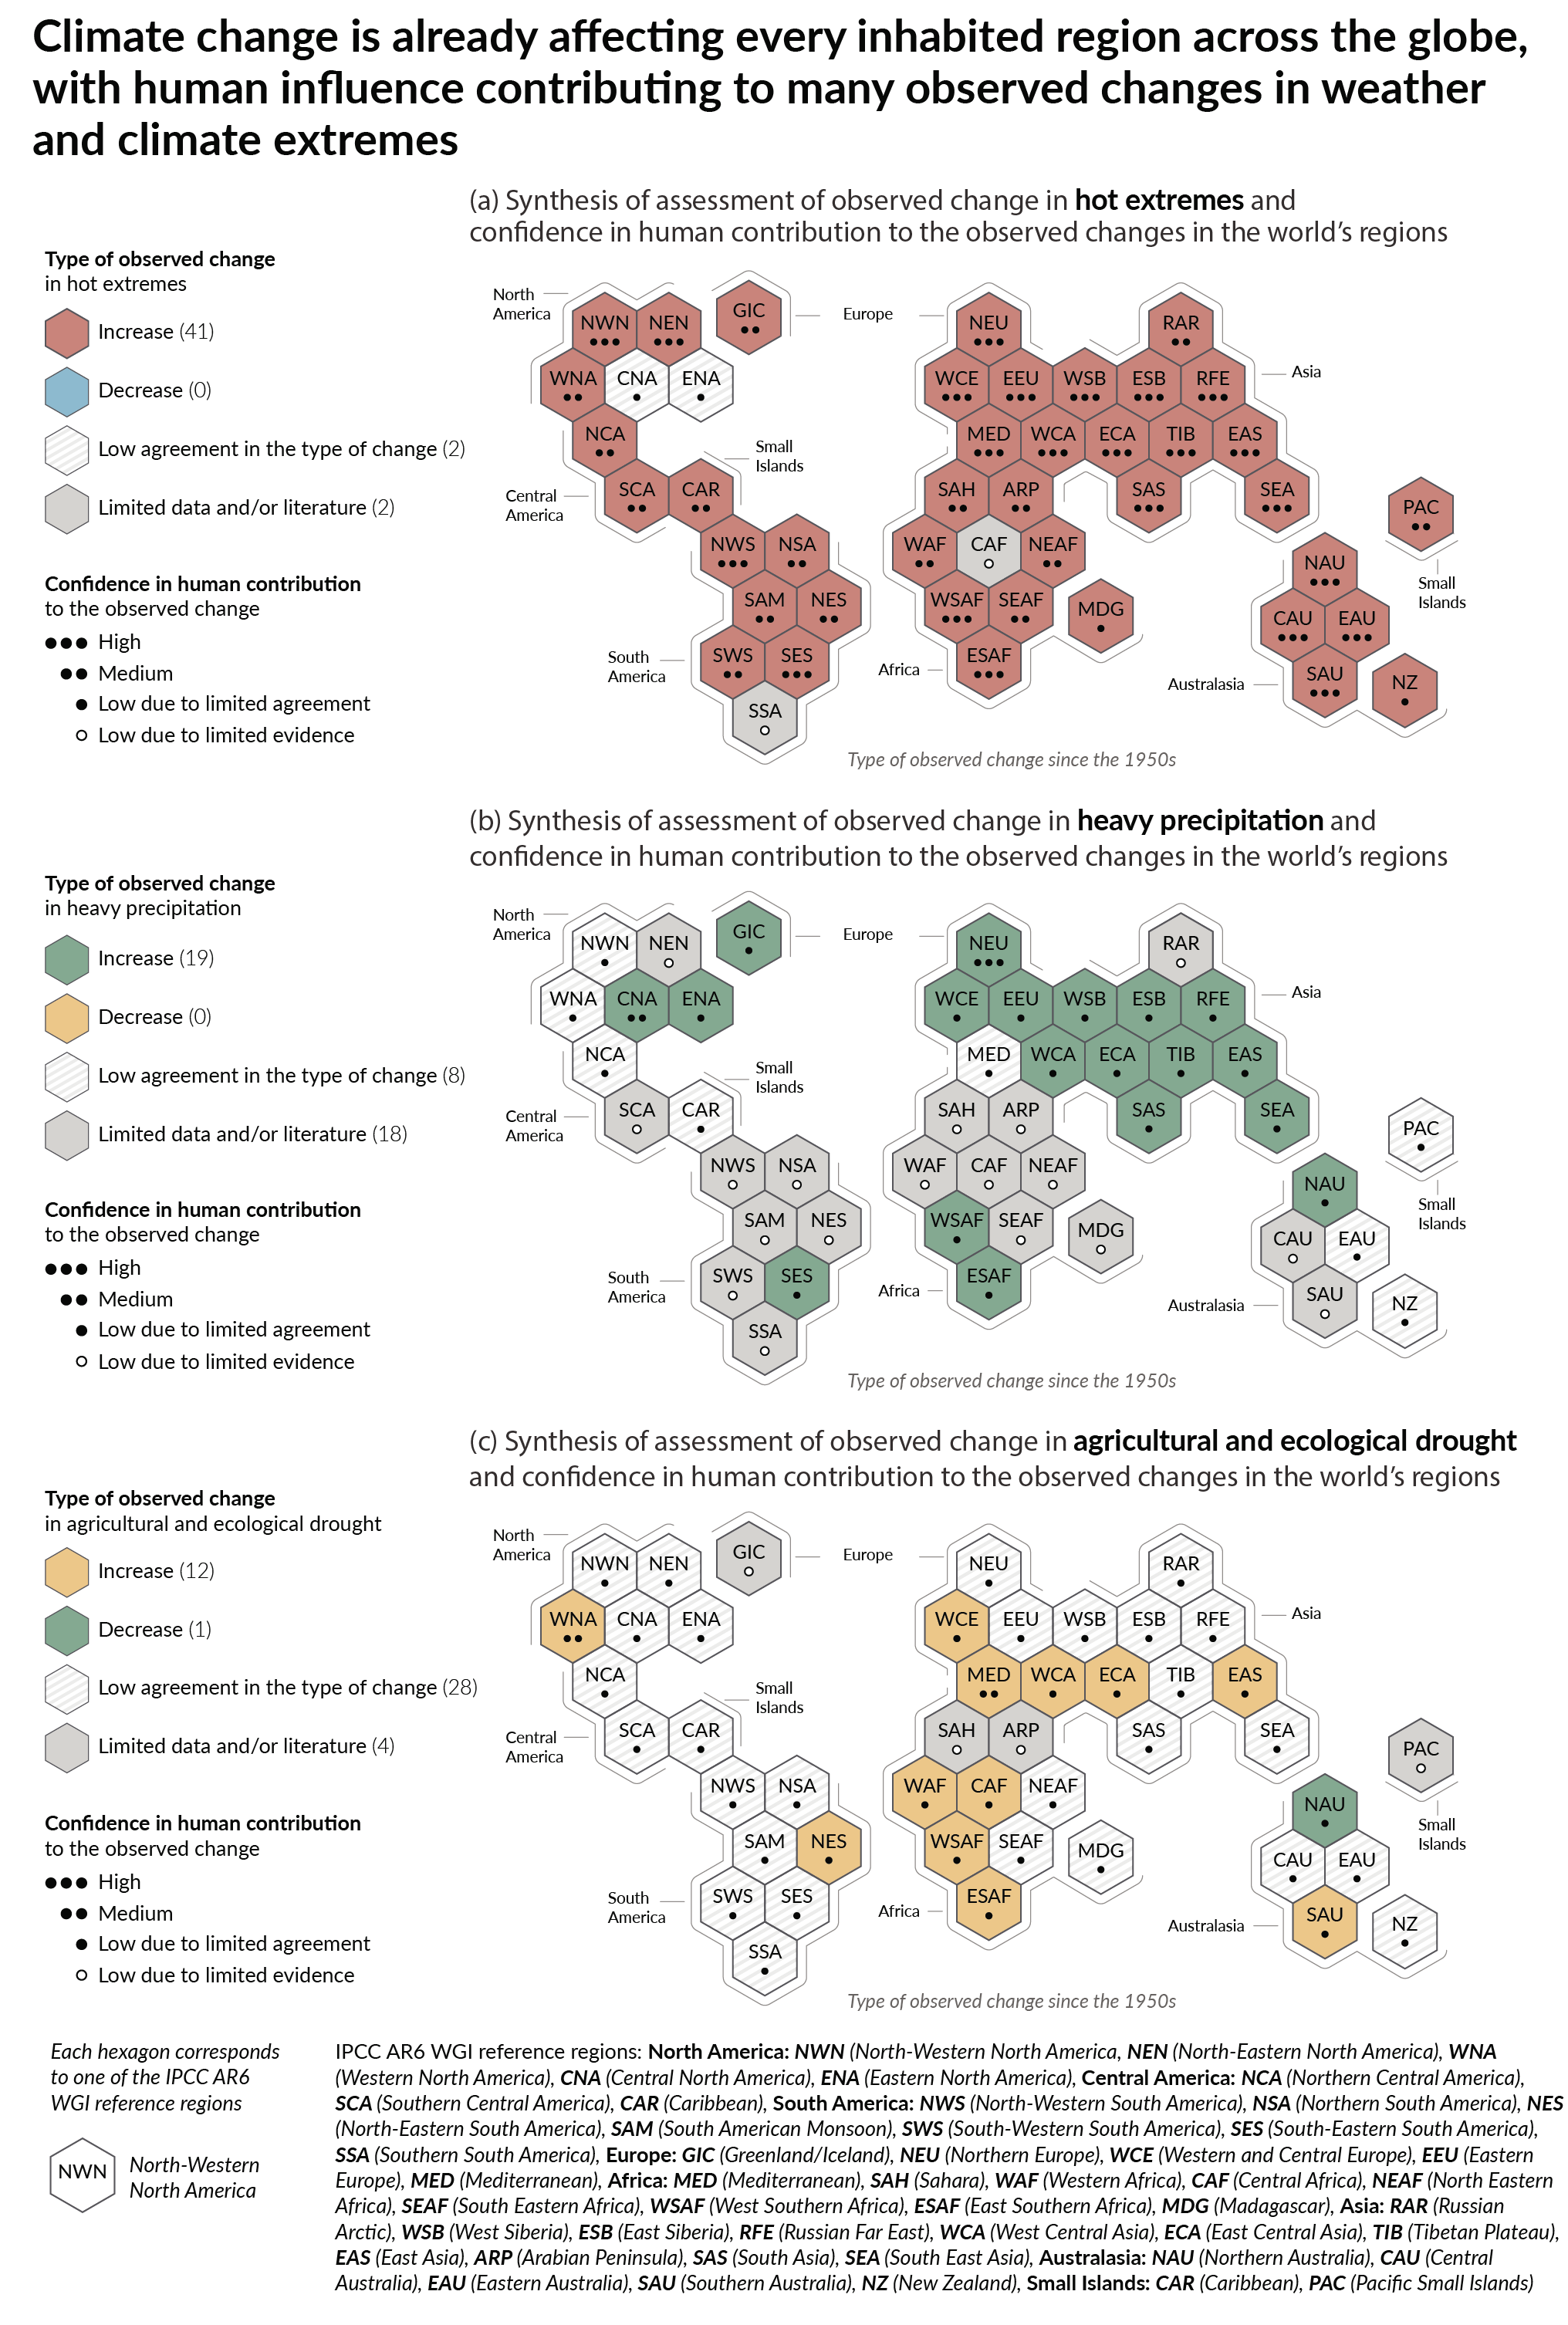
Figure caption
Box TS.10, Figure 1 | Synthesis of assessed observed and attributable regional changes. The IPCC AR6 WGI inhabited regions are displayed as hexagons of identical sizes in their approximate geographical location (see legend for regional acronyms). All assessments are made for each region as a whole and for the 1950s to the present. Assessments made on different time scales or more local spatial scales might differ from what is shown in the figure. The colours in each panel represent the four outcomes of the assessment on observed changes. Striped hexagons (white and light-grey) are used where there is low agreement in the type of change for the region as a whole, and grey hexagons are used when there is limited data and/or literature that prevents an assessment of the region as a whole. Other colours indicate at least medium confidence in the observed change. The confidence level for the human influence on these observed changes is based on assessing trend detection and attribution and event attribution literature, and it is indicated by the number of dots: three dots for high confidence, two dots formedium confidence and one dot for low confidence (single, filled dot: limited agreement; single, empty dot: limited evidence).