Box TS.13, Figure 1
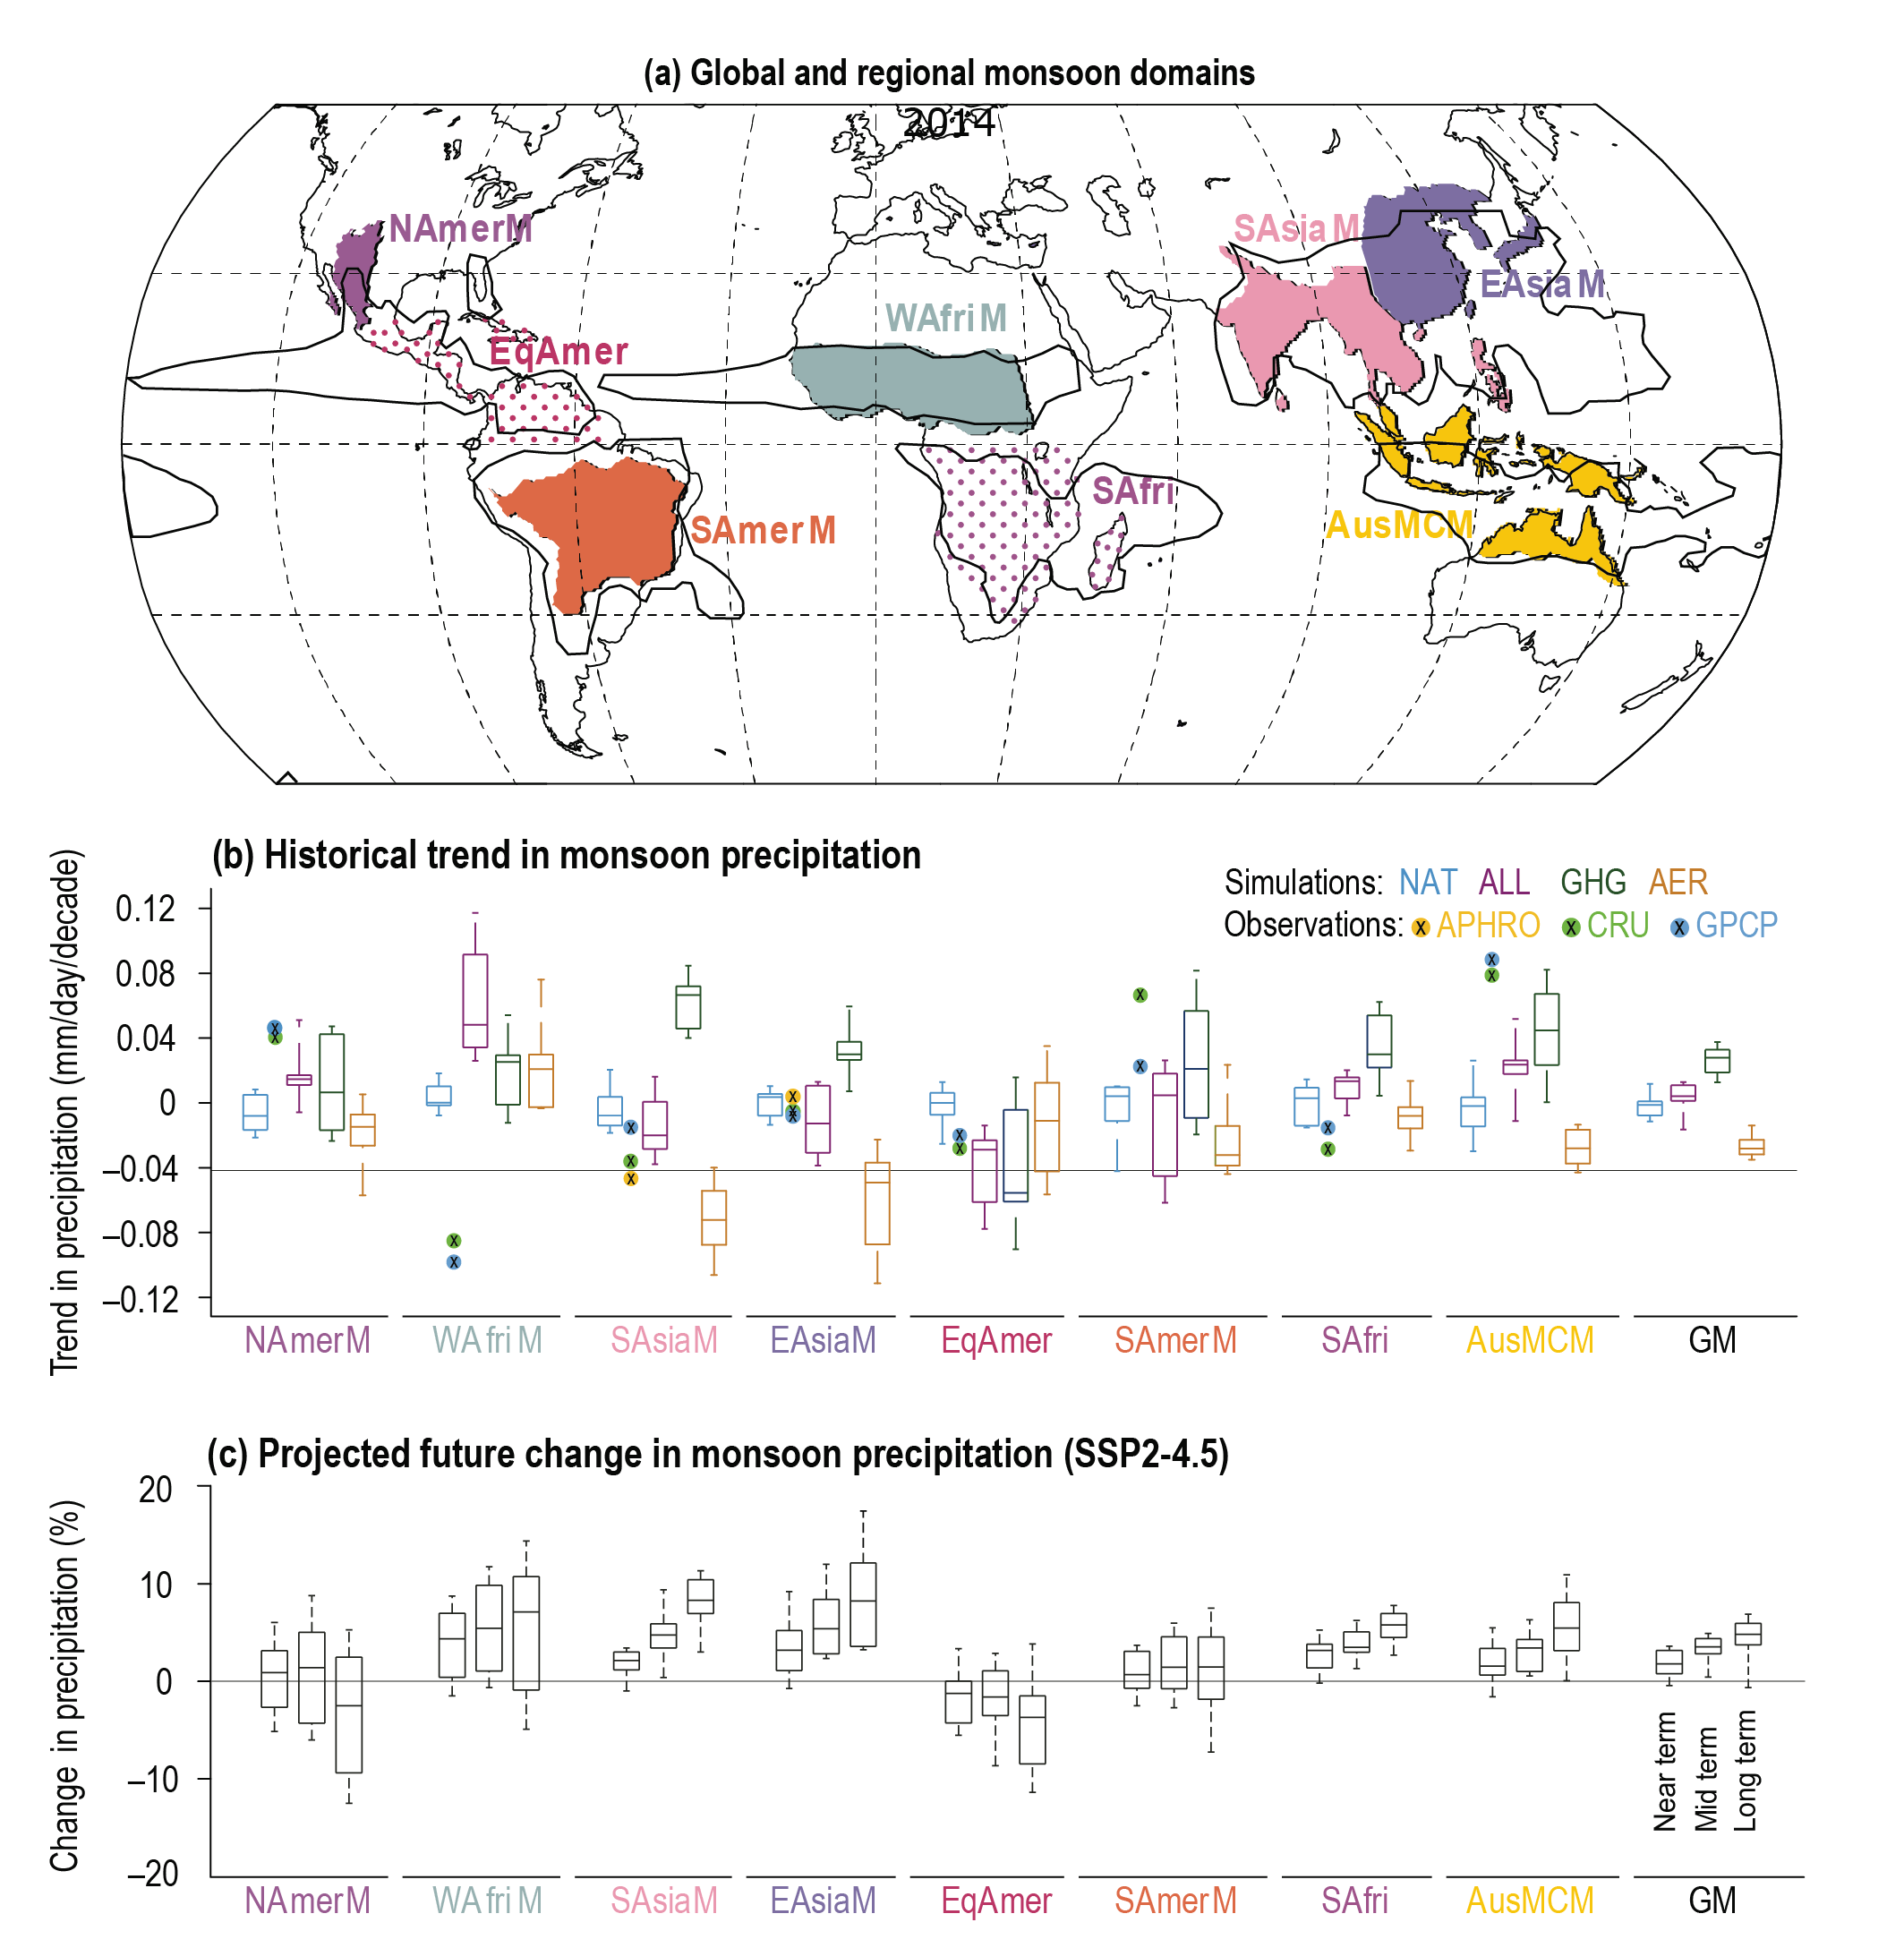
Figure caption
Box TS.13, Figure 1 | Global and regional monsoons: past trends and projected changes. The intent of this figure is to show changes in precipitation over regional monsoon domains in terms of observed past trends, how greenhouse gases and aerosols relate to these changes, and in terms of future projections in one intermediate emissions scenario in the near, medium and long term. (a) Global (black contour) and regional monsoons (colour shaded) domains. The global monsoon (GM) is defined as the area with local summer-minus-winter precipitation rate exceeding 2.5 mm day–1 (see Annex V). The regional monsoon domains are defined based on published literature and expert judgement (see Annex V) and accounting for the fact that the climatological summer monsoon rainy season varies across the individual regions. Assessed regional monsoons are South and South East Asia (SAsiaM, Jun–July–August–September), East Asia (EAsiaM, June–July–August), West Africa (WAfriM, June–July–August–September), North America (NAmerM, July–August–-September), South America (SAmerM, December–January–February), Australia and Maritime Continent Monsoon (AusMCM, December–January–February). Equatorial South America (EqSAmer) and South Africa (SAfri)regions are also shown, as they receive unimodal summer seasonal rainfall although their qualification as monsoons is subject to discussion. (b) Global and regional monsoons precipitation trends based on DAMIP CMIP6 simulations with both natural and anthropogenic (ALL), greenhouse gas only (GHG), aerosols only (AER) and natural only (NAT) radiative forcing. Weighted ensemble means are based on nine Coupled model Intercomparison Project Phase 6 (CMIP6) models contributing to the MIP (with at least three members). Observed trends computed from CRU, GPCP and APHRO (only forSAsiaM and EAsiaM) datasets are shown as well. (c) Percentage change in projected seasonal mean precipitation over global and regional monsoons domain in the near term (2021–2040), mid-term (2041–2060), and long term (2081–2100) under SSP2-4.5 based on 24 CMIP6 models. {Figures 8.11 and 8.22}