Back chapter figures
Box TS.2, Figure 1
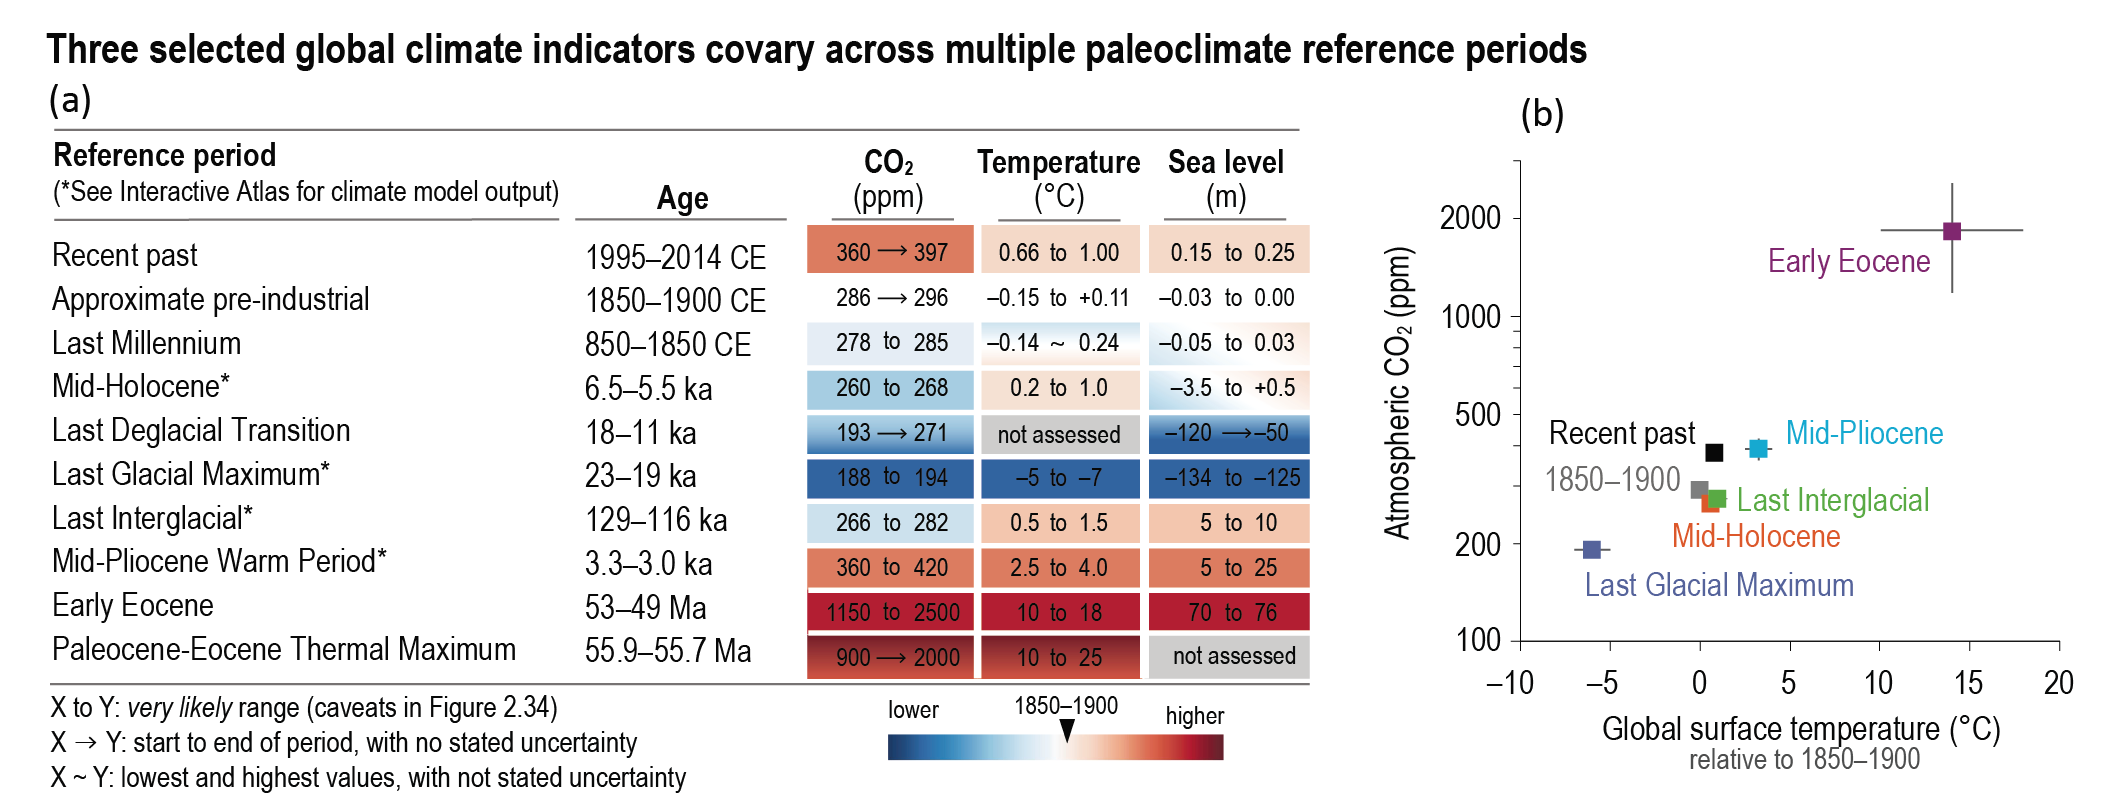
Figure caption
Box TS.2, Figure 1 | Paleoclimate and recent reference periods, with selected key indicators. The intent of this figure is to list the paleoclimate reference periods used in this Report, to summarize three key global climate indicators, and compare CO2 with global temperature over multiple periods. (a) Three large-scale climate indicators (atmospheric CO2, global surface temperature relative to 1850–1900, and global mean sea level relative to 1900), based on assessments in Chapter 2, with confidence levels ranging fromlow tovery high. (b) Comparison between global surface temperature (relative to 1850–1900) and atmospheric CO2 concentration (shown on a log scale) for multiple reference periods (mid-points with 5–95% ranges). {2.2.3, 2.3.1.1, 2.3.3.3, Figure 2.34}