Back chapter figures
Box TS.3, Figure 1
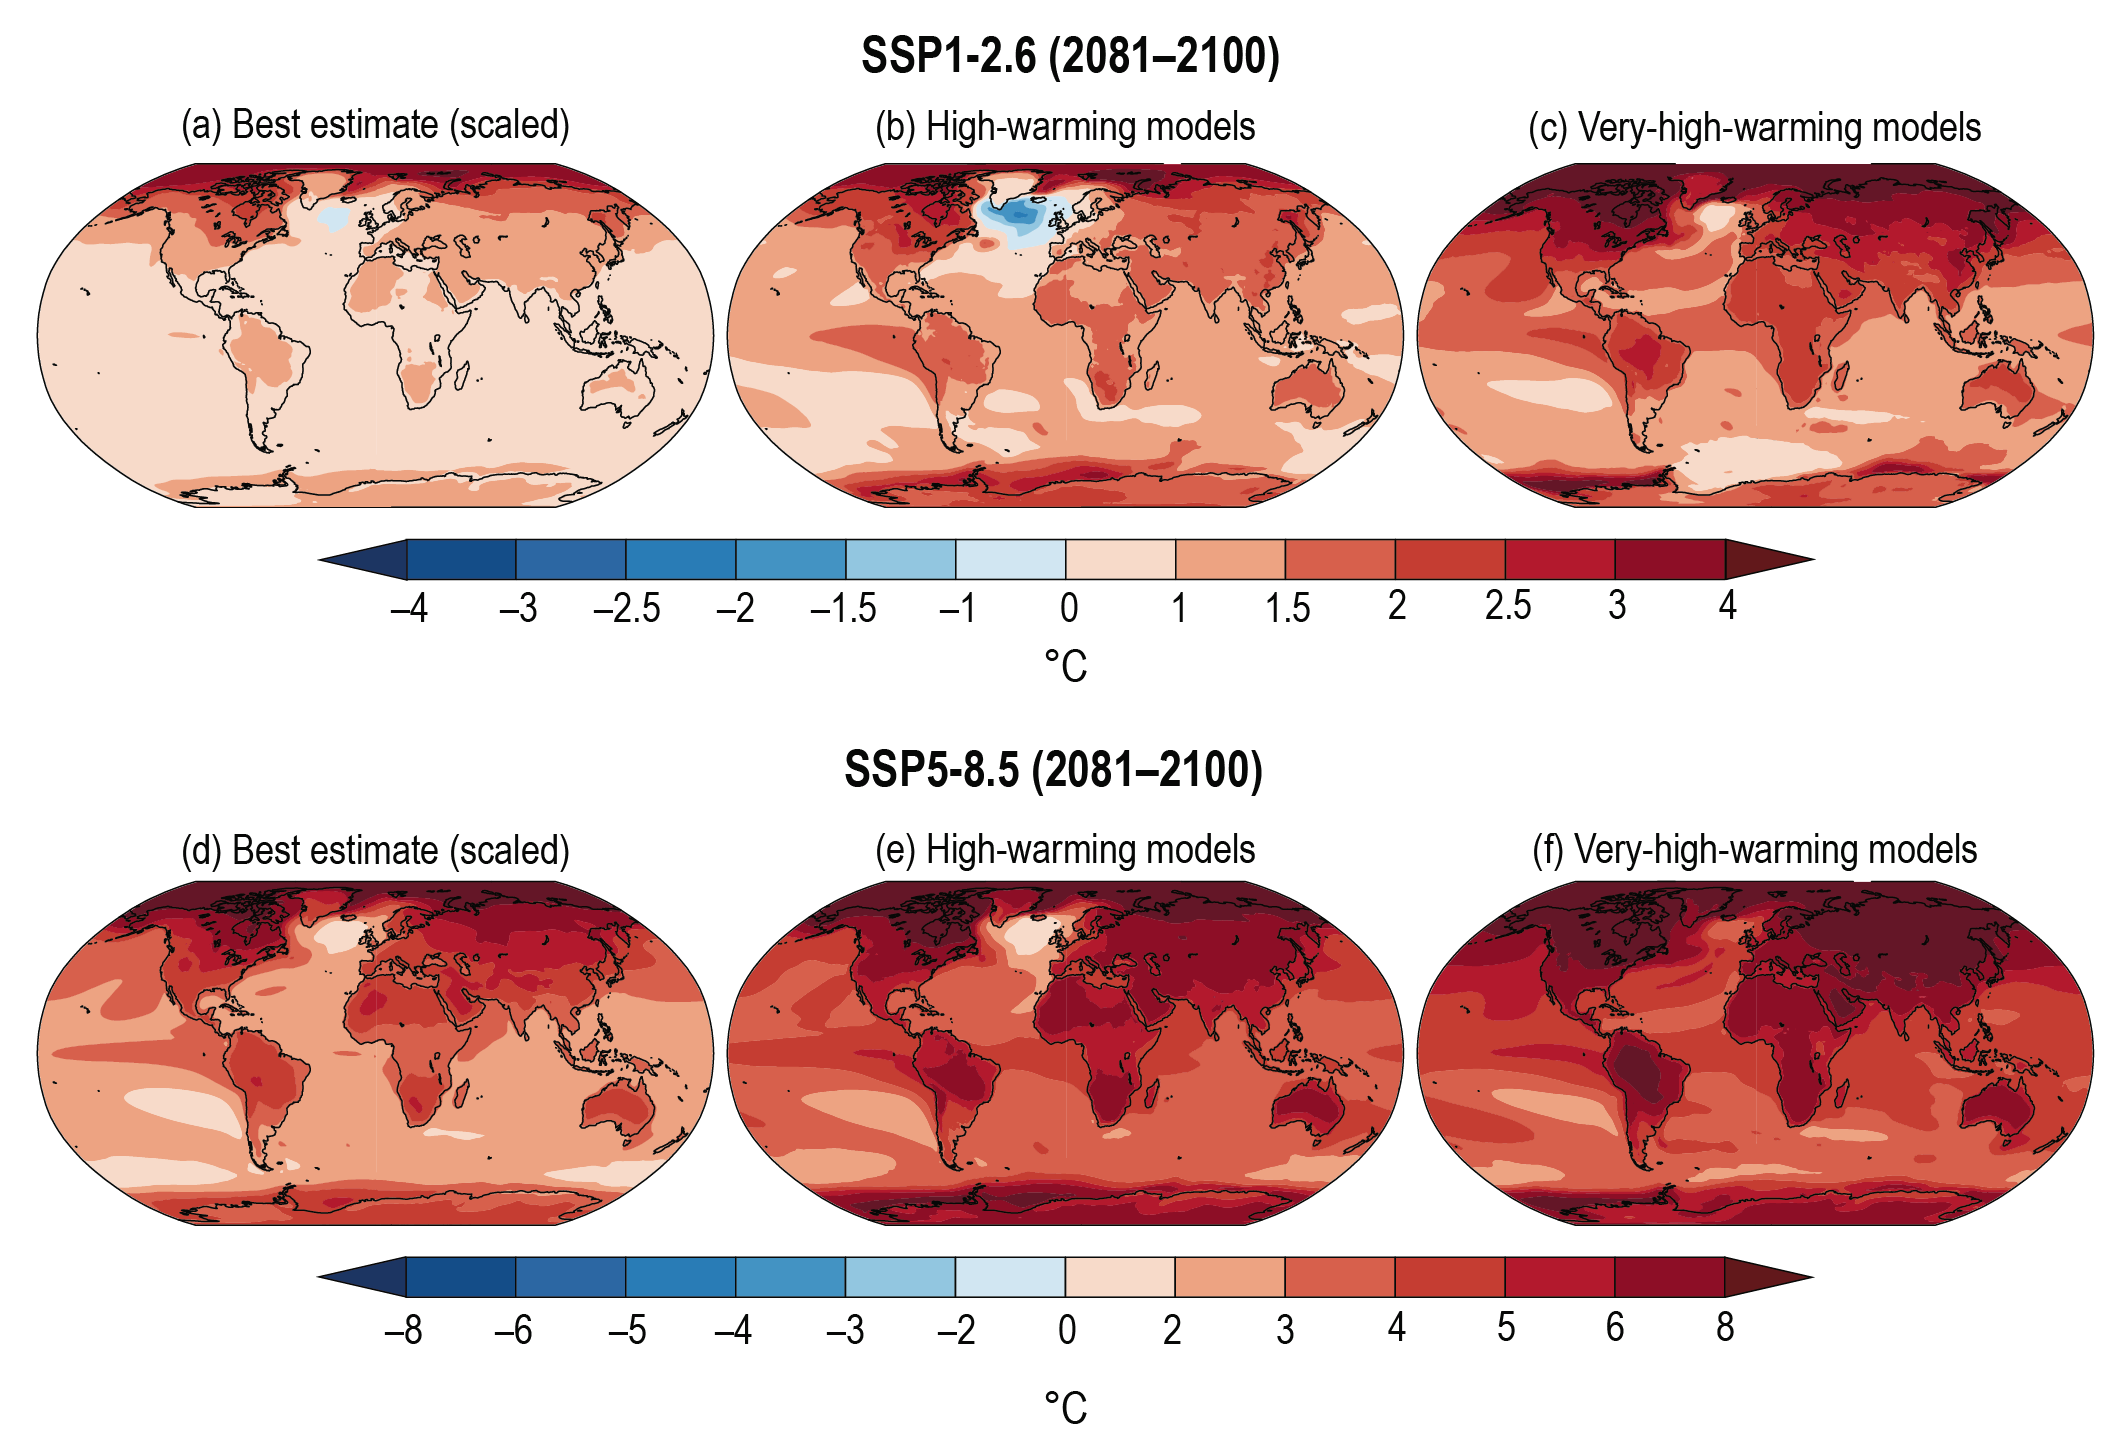
Figure caption
Box TS.3, Figure 1 | High-warming storylines. The intent of this figure is to illustrate high warming storylines compared to the CMIP6 multi-model-mean. (a) Coupled Model Intercomparison Project Phase 6 (CMIP6) multi-model mean linearly scaled to the assessed best global surface temperature estimate for SSP1-2.6 in 2081–2100 relative to 1995–2014, (b) mean across five high-warming models with global surface temperature changes nearest to the upper bound of the assessed very likely range, and (c) mean across five very high-warming models with global surface temperature changes higher than the assessed very likely . (d–f) Same as (a–c) but for SSP5-8.5. Note the different colour bars in (a–c) and (d–f). {4.7, Figure 4.41}