Box TS.4, Figure 1
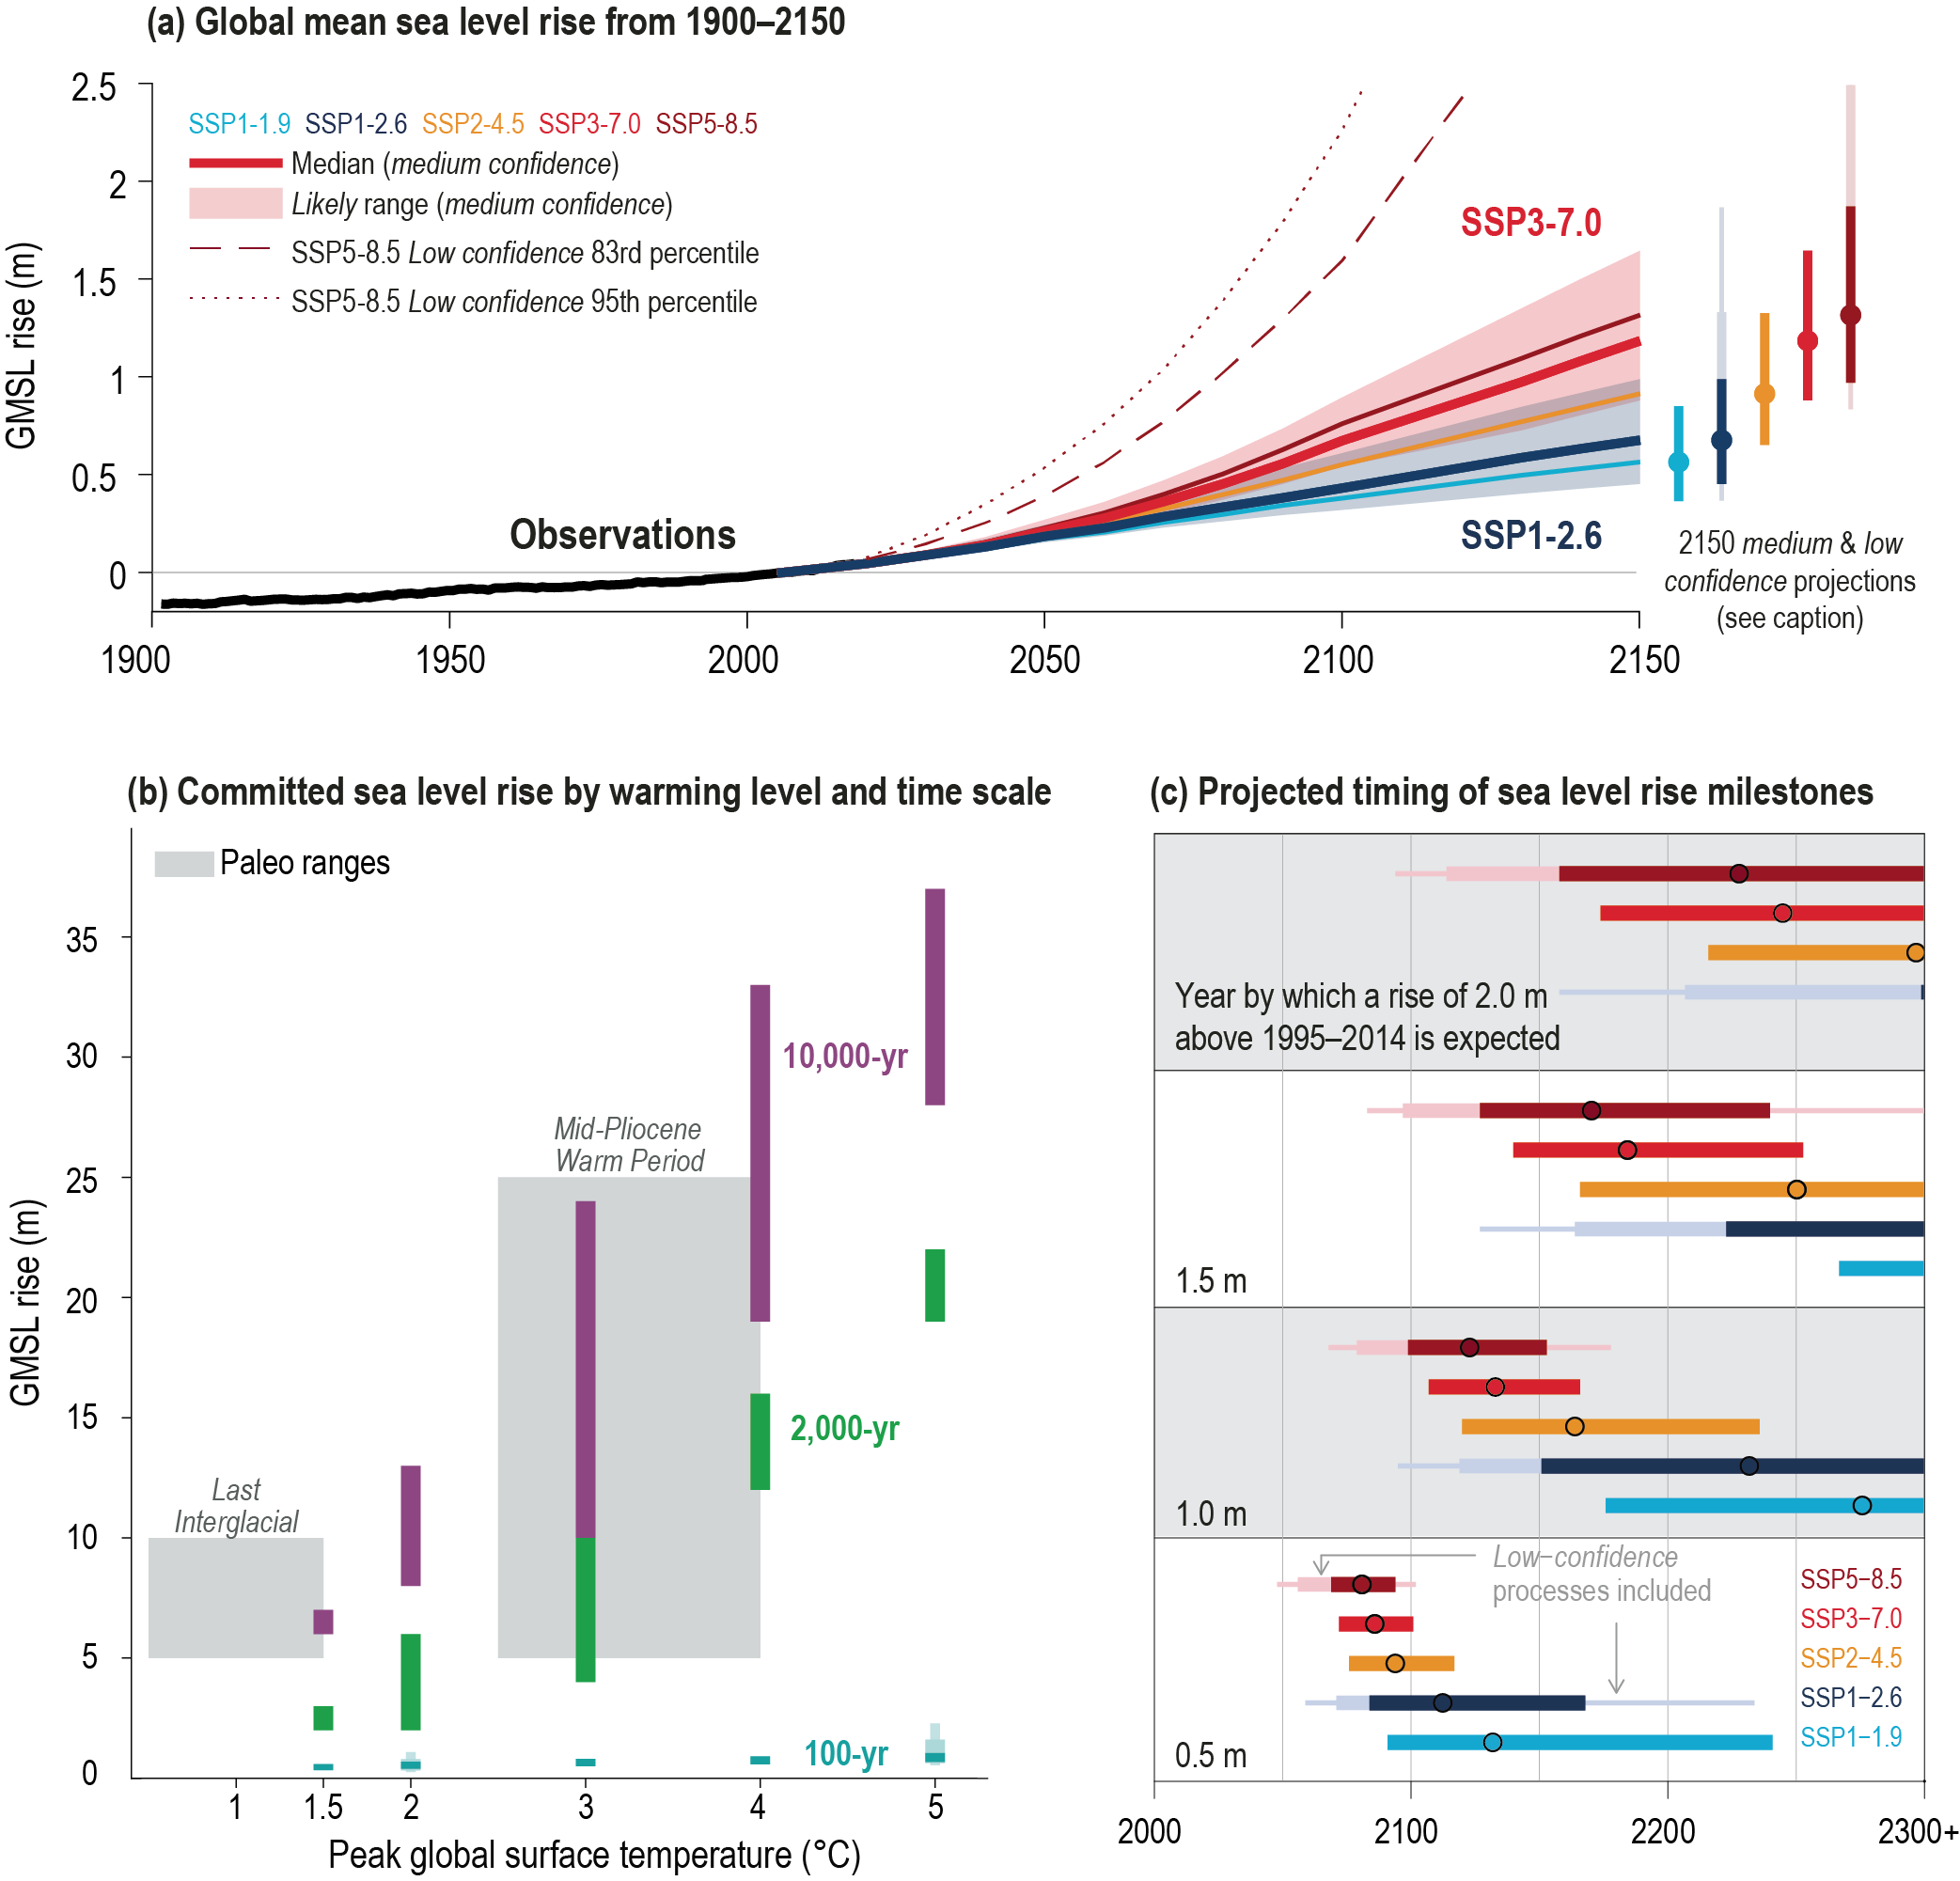
Figure caption
Box TS.4, Figure 1 | Global mean sea level (GMSL) change on different time scales and under different scenarios. The intent of this figure is to (i) show the century-scale GMSL projections in the context of the 20th century observations, (ii) illustrate ‘deep uncertainty’ in projections by considering the timing of GMSL rise milestones, and (iii) show the long-term commitment associated with different warming levels, including the paleo evidence to support this. (a) GMSL change from 1900 to 2150, observed (1900–2018) and projected under the SSP scenarios (2000–2150), relative to a 1995–2014 baseline. Solid lines show median projections. Shaded regions showlikely ranges for SSP1-2.6 and SSP3-7.0. Dotted and dashed lines show respectively the 83rd and 95th percentilelow confidence projections for SSP5-8.5. Bars at right showlikely ranges for SSP1-1.9, SSP1-2.6, SSP2-4.5, SSP3-7.0 and SSP5-8.5 in 2150. Lightly shaded thick/thin bars show 17th–83rd/5th–95th percentile low-confidence ranges in 2150 for SSP1-2.6 and SSP5-8.5, based upon projection methods incorporating structured expert judgement and marine ice cliff instability. Low confidence range for SSP5-8.5 in 2150 extends to 4.8/5.4 m at the 83rd/95th percentile. (b) GMSL change on 100- (blue), 2000- (green) and 10,000-year (magenta) time scales as a function of global surface temperature, relative to 1850–1900. For 100-year projections, GMSL is projected for the year 2100, relative to a 1995–2014 baseline, and temperature anomalies are average values over 2081–2100. For longer-term commitments, warming is indexed by peak warming above 1850–1900 reached after cessation of emissions. Shaded regions show paleo-constraints on global surface temperature and GMSL for the Last Interglacial and mid-Pliocene Warm Period. Lightly shaded thick/thin blue bars show 17th–83rd/5th–95th percentile low confidence ranges for SSP1-2.6 and SSP5-8.5 in 2100, plotted at 2°C and 5°C. (c) Timing of exceedance of GMSL thresholds of 0.5, 1.0, 1.5 and 2.0 m, under different SSPs. Lightly shaded thick/thin bars show 17th–83rd/5th–95th percentile low-confidence ranges for SSP1-2.6 and SSP5-8.5. {4.3.2, 9.6.1, 9.6.2, 9.6.3, Box 9.4}