Box TS.5, Figure 1
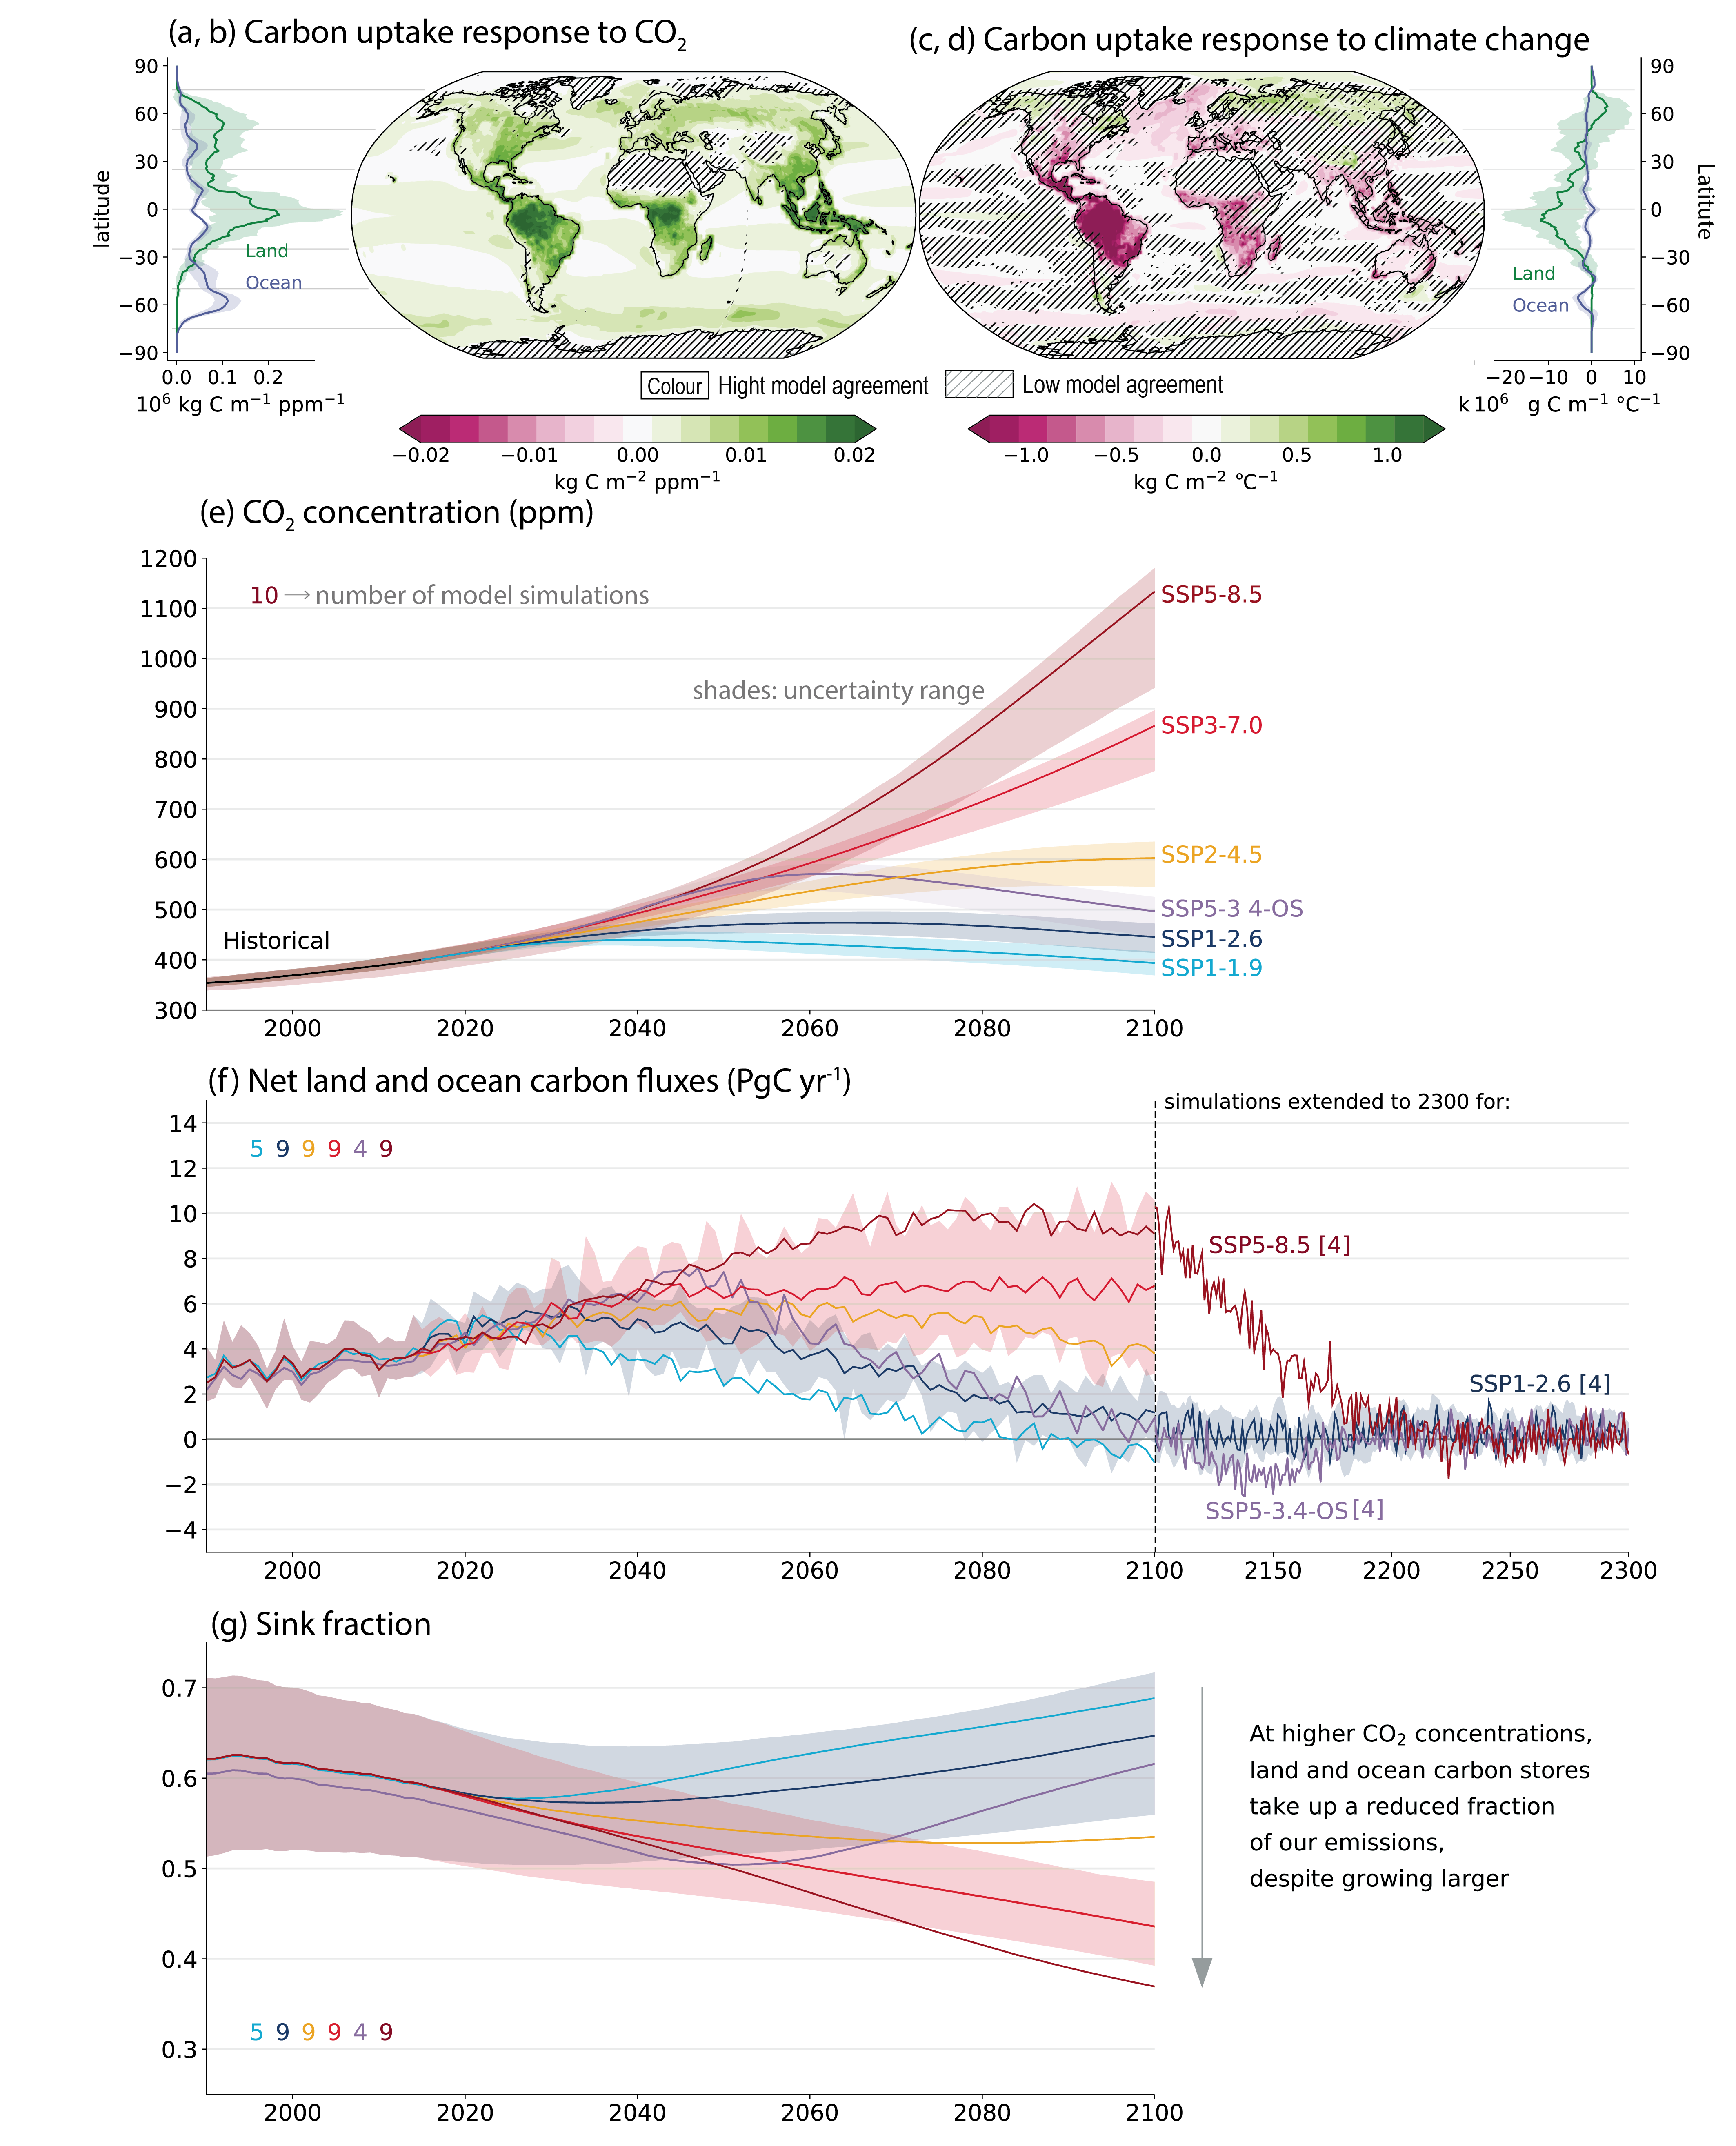
Figure caption
Box TS.5, Figure 1 | Carbon cycle processes and projections. The intent of this figure is to show the response of the carbon cycle to carbon dioxide (CO2) emissions and climate and its role in determining future CO2levels through projected changes to sinks and sink fractions. The figure shows changes in carbon storage in response to elevated CO2 (a, b) and the response to climate warming (c, d). Maps show spatial patterns of changes in carbon uptake during simulations with 1% per year increase in CO2 (Section 5.4.5.5), and zonal mean plots show distribution of carbon changes is dominated by the land (green lines) in the tropics and Northern Hemisphere and ocean (blue lines) in the Southern Hemisphere. Hatching indicates regions where fewer than 80% of models agree on the sign of response. (e) Future CO2 projections: projected CO2 concentrations in the Shared Socio-economic Pathway (SSP) scenarios in response to anthropogenic emissions, results from coupled Earth system models for SSP5-8.5 and from the MAGICC7 emulator for other scenarios (Section 4.3.1). (f) Future carbon fluxes: projected combined land and ocean fluxes (positive downward) up to 2100 for the SSP scenarios, and extended to 2300 for available scenarios, 5–95% uncertainty plumes shown for SSP1-2.6 and SSP3-7.0 (Sections 4.3.2.4, 5.4.5.4 and 5.4.10). The numbers near the top show the number of model simulations used. (g) Sink fraction: the fraction of cumulative emissions of CO2 removed by land and ocean sinks. The sink fraction is smaller under conditions of higher emissions. {Figure 4.3; 5.4.5; Figures 5.25, 5.27 and 5.30}