Box TS.6, Figure 1
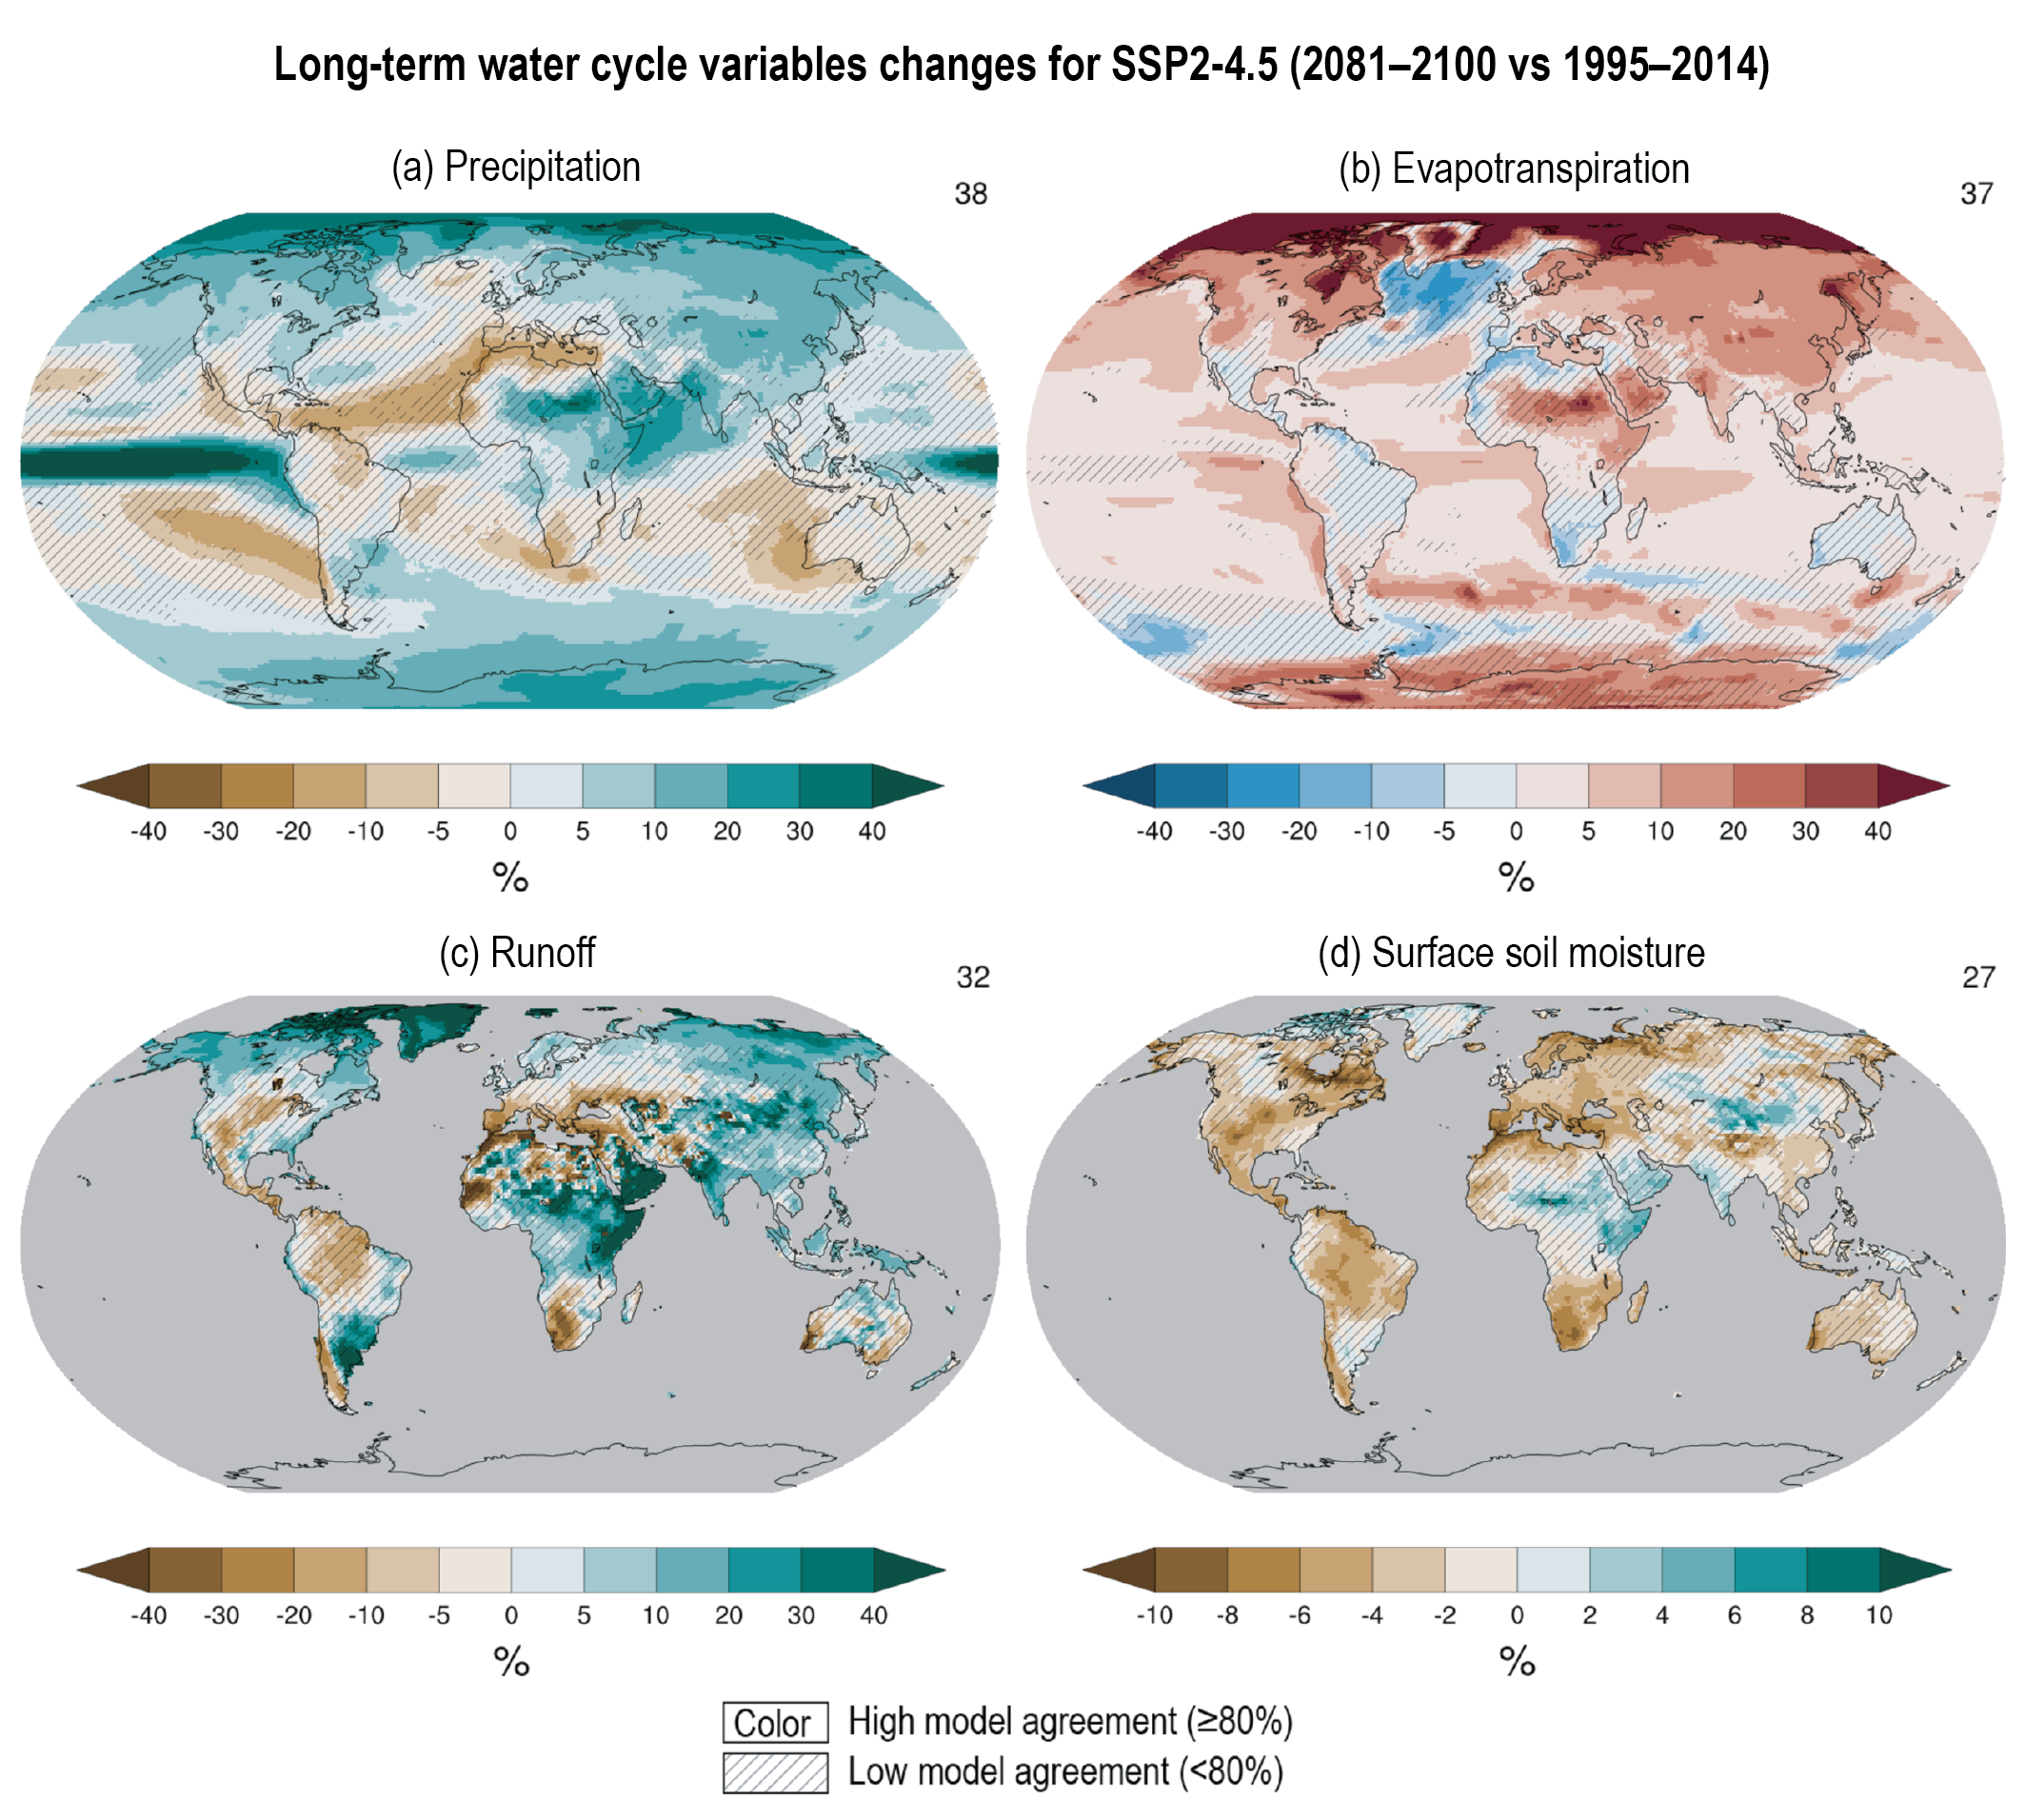
Figure caption
Box TS.6, Figure 1 | Projected water cycle changes. The intent of this figure is to give a geographical overview of changes in multiple components of the global water cycle using an intermediate emissions scenario. Important key message: without drastic reductions in greenhouse gas emissions, human-induced global warming will be associated with widespread changes in all components of the water cycle. Long-term (2081–2100) projected annual mean changes (%) relative to present-day (1995–2014) in the SSP2-4.5 emissions scenario for (a) precipitation, (b) surface evapotranspiration, (c) total runoff and (d) surface soil moisture. Numbers in top right of each panel indicate indicate the number of Coupled Model Intercomparison Project Phase 6 (CMIP6) models used for estimating the ensemble mean. For other scenarios, please refer to relevant figures in Chapter 8. Uncertainty is represented using the simple approach: No overlay indicates regions with high model agreement, where ≥80% of models agree on sign of change; diagonal lines indicate regions with low model agreement, where <80% of models agree on sign of change. For more information on the simple approach, please refer to the Cross-Chapter Box Atlas.1. {8.4.1; Figures 8.14, 8.17, 8.18, and 8.19}