Back chapter figures
Figure TS.1
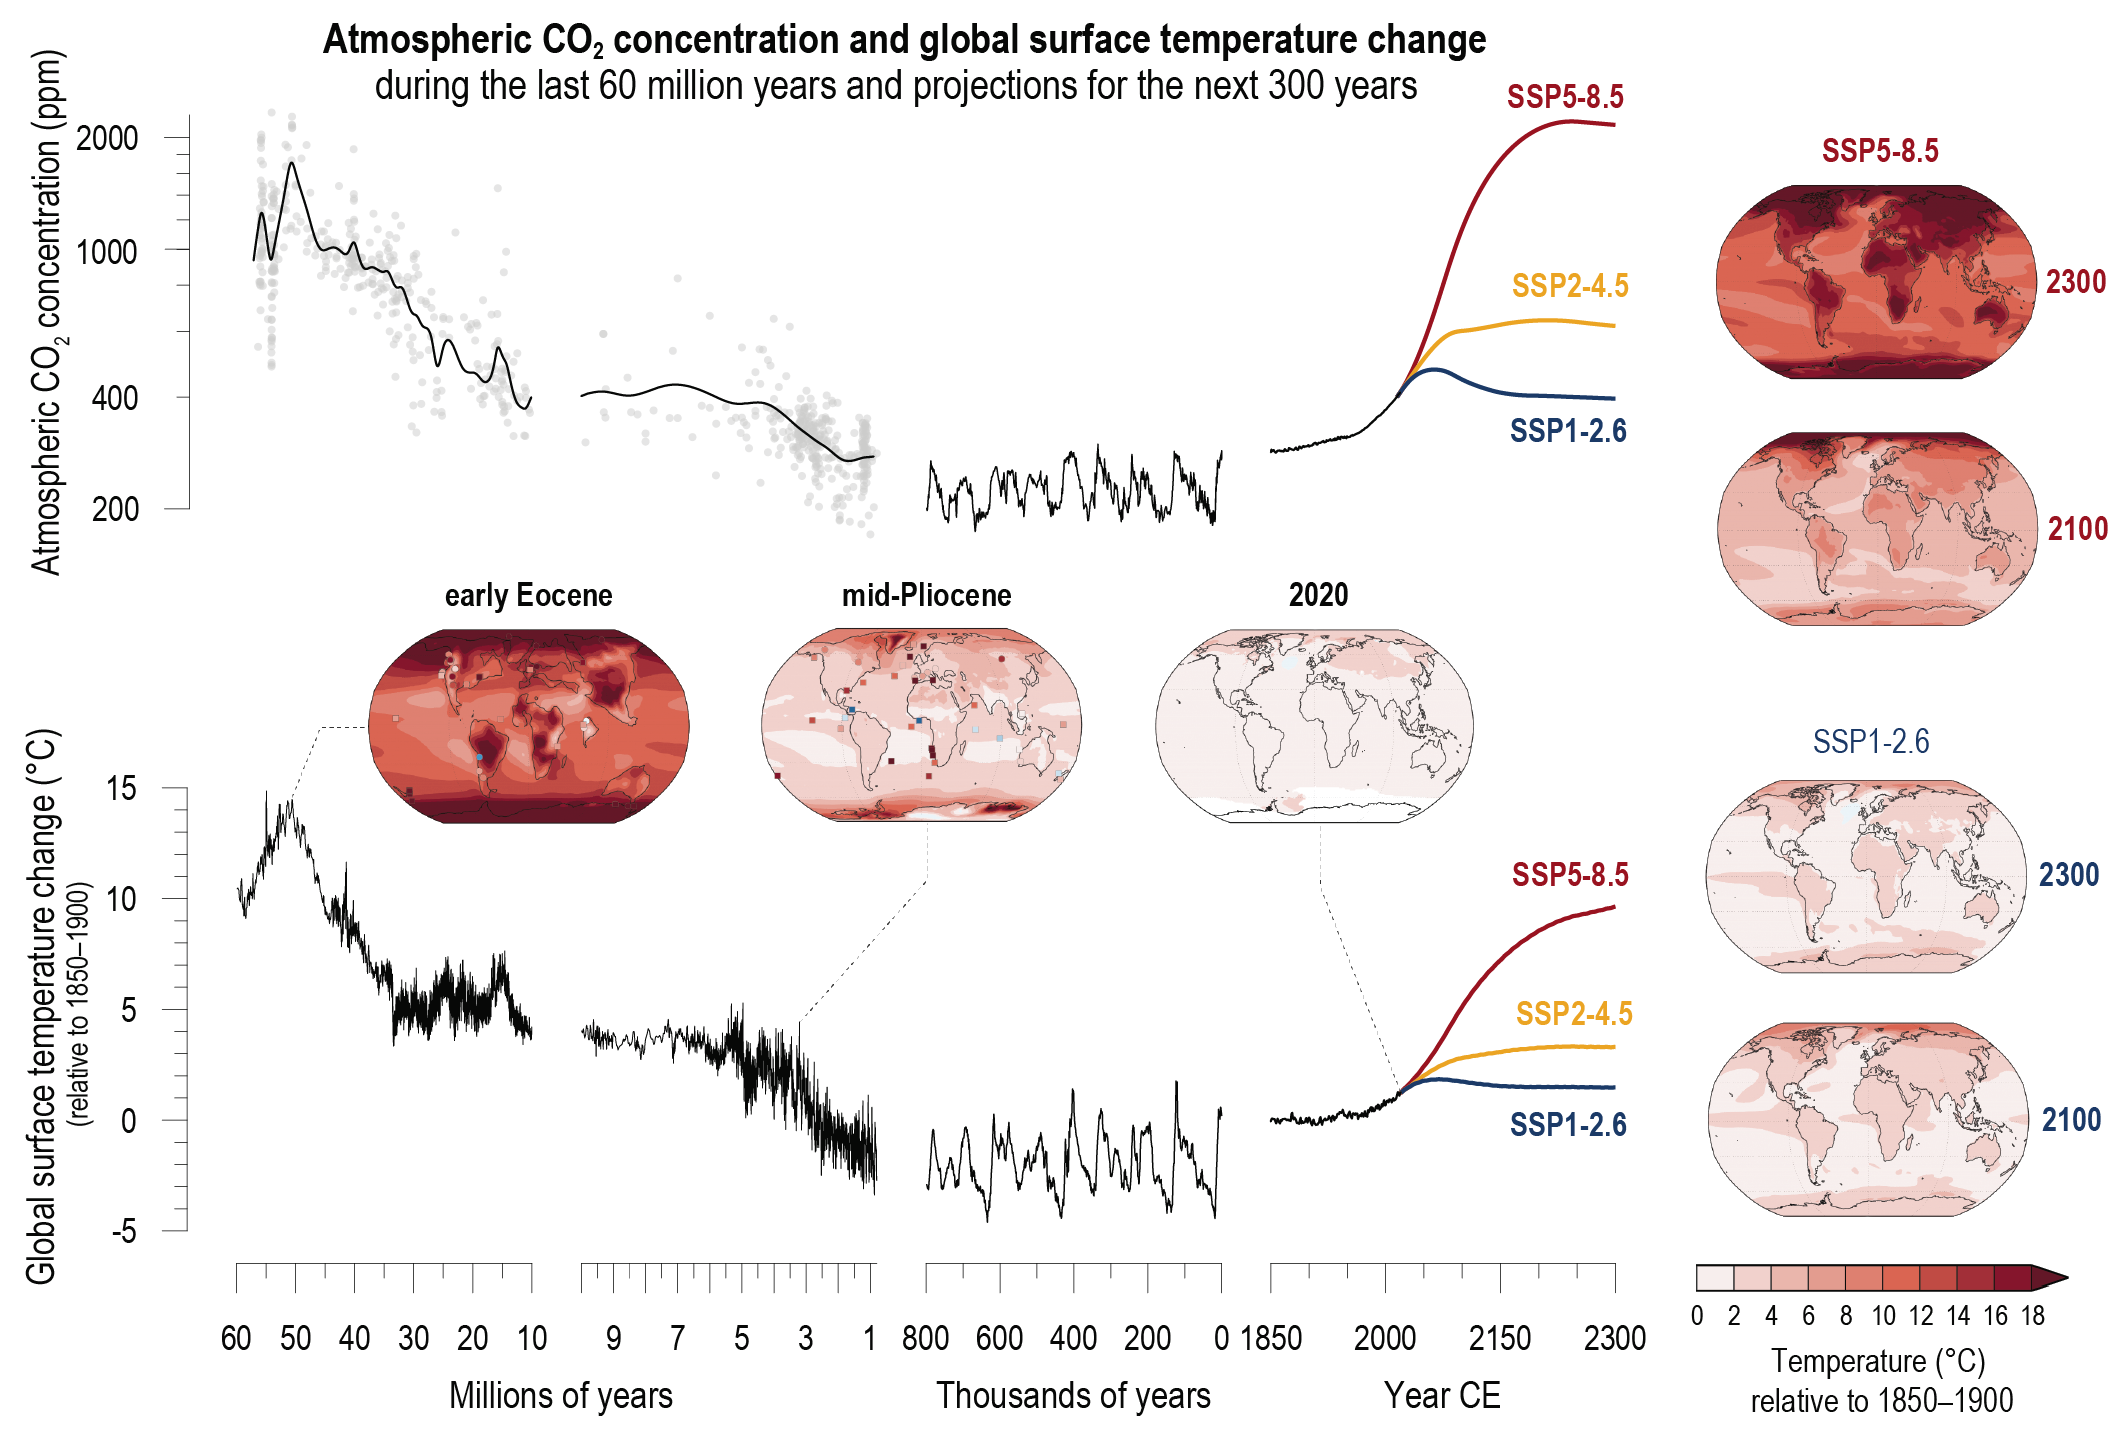
Figure caption
Figure TS.1 | Changes in atmospheric CO2and global surface temperature (relative to 1850–1900) from the deep past to the next 300 years. The intent of this figure is to show that CO2 and temperature covary, both in the past and into the future, and that projected CO2 and temperatures are similar to those only from many millions of years ago. CO2 concentrations from millions of years ago are reconstructed from multiple proxy records (grey dots are data from Section 2.2.3.1, Figure 2.3 shown with cubic-spline fit). CO2 levels for the last 800,000 years through the mid-20th century are from air trapped in polar ice; recent values are from direct air measurements. Global surface temperature prior to 1850 is estimated from marine oxygen isotopes, one of multiple sources of evidence used to assess paleo temperatures in this Report. Temperature of the past 170 years is the AR6 assessed mean. CO2 levels and global surface temperature change for the future are shown for three Shared Socio-economic Pathway (SSP) scenarios through 2300 CE, using Earth system model emulators calibrated to the assessed global surface temperatures. Their smooth trajectories do not account for inter-annual to inter-decadal variability, including transient response to potential volcanic eruptions. Global maps for two paleo reference periods are based on Coupled Model Intercomparison Project Phase 6 (CMIP6) and pre-CMIP6 multi-model means, with site-level proxy data for comparison (squares and circles are marine and terrestrial, respectively). The map for 2020 is an estimate of the total observed warming since 1850–1900. Global maps at right show two SSP scenarios at 2100 (2081–2100) and at 2300 (2281–2300; map from CMIP6 models; temperature assessed in 4.7.1). A brief account of the major climate forcings associated with past global temperature changes is in Cross-Chapter Box 2.1. (Section TS.1.3, Figure TS.9, Cross-Section Box TS.1, Box TS.2) {1.2.1.2; Figures 1.14 and 1.5; 2.2.3; 2.3.1.1; 2.3.1.1.1; Figures 2.4 and 2.5; Cross-Chapter Box 2.1, Figure 1; 4.5.1; 4.7.1; Cross-Chapter Box 4.1; Cross-Chapter Box 7.1; Figure 7.13}