Back chapter figures
Figure TS.0
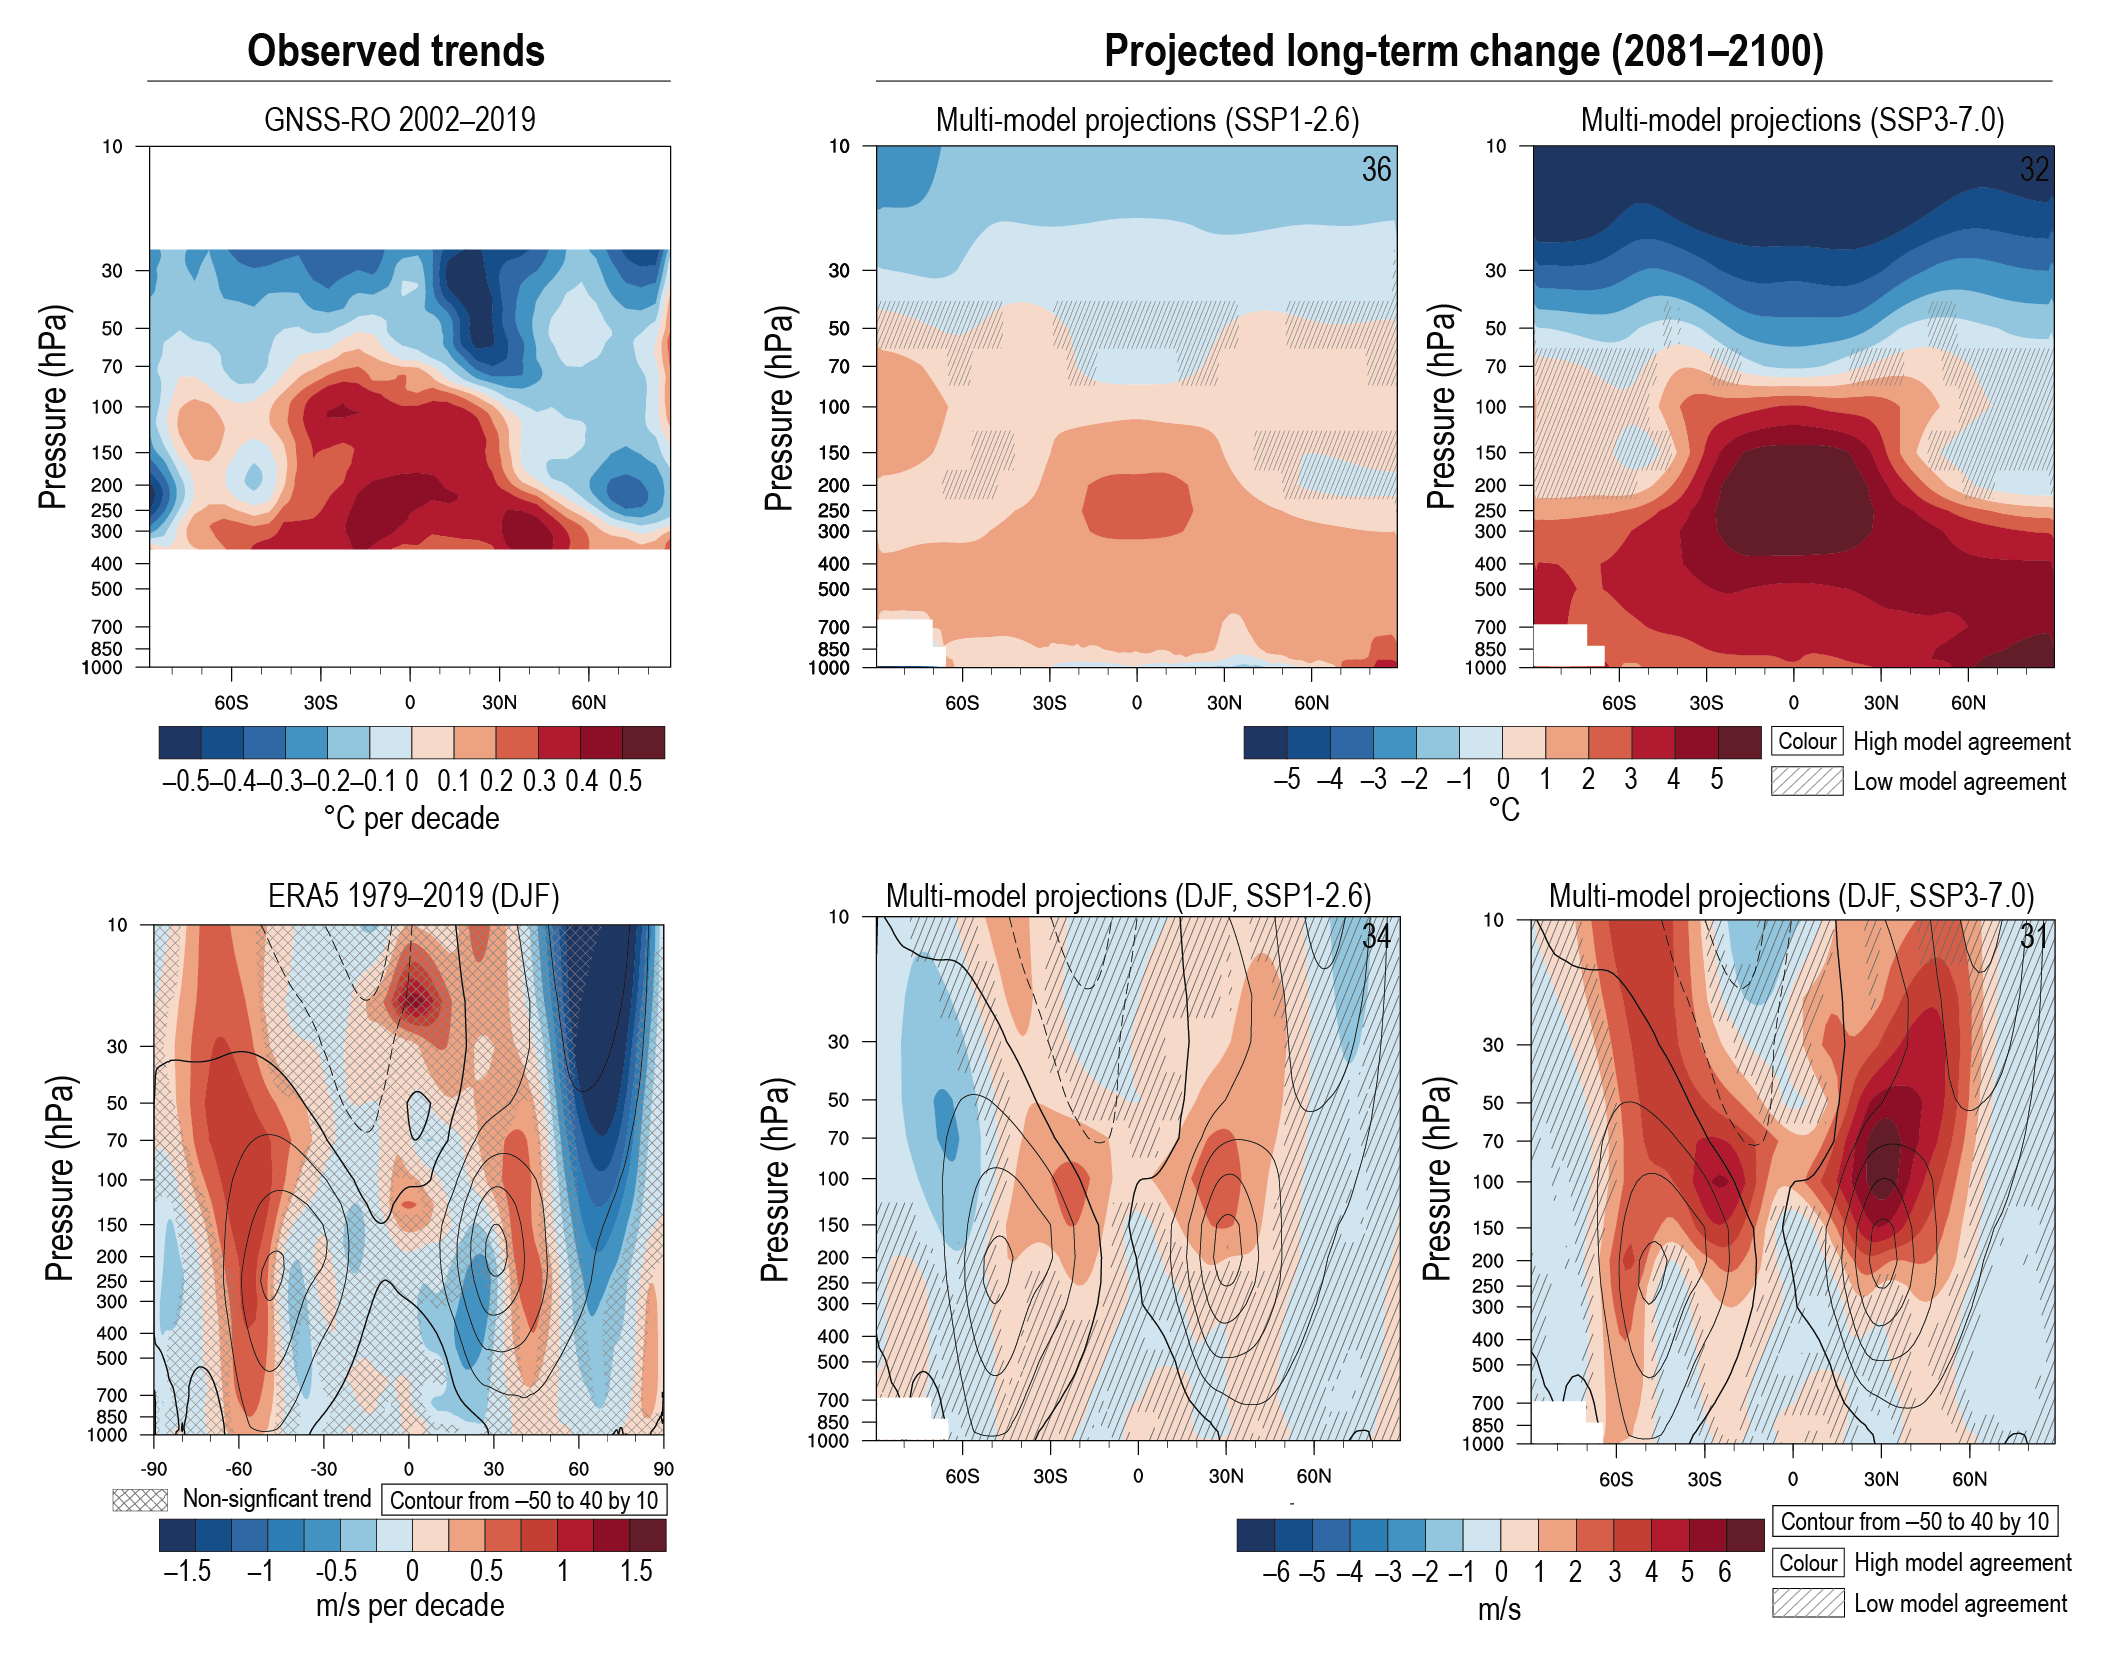
Figure caption
Figure TS.10 | Observed and projected upper air temperature and circulation changes. The intent of this figure is to visualize upper air temperature and circulation changes and the similarity between observed and projected changes. Upper panels: (left) Zonal cross-section of temperature trends for 2002–2019 in the upper troposphere region for the ROM SAF radio-occultation dataset. (Middle) Change in the annual and zonal mean atmospheric temperature (°C) in 2081–2100 in SSP1-2.6 relative to 1995–2014 for 36 Coupled Model Intercomparison Project Phase 6 (CMIP6) models. (right) the same in SSP3-7.0 for 32 models. Lower panels: (left) Long-term mean (thin black colour) and linear trend (colour) of zonal mean December–January–February (DJF) zonal winds for ERA5. (Middle) multi-model mean change in annual and zonal mean wind (m s–1) in 2081–2100 in SSP1-2.6 relative to 1995–2014 based on 34 CMIP6 models. The 1995–2014 climatology is shown in contours with spacing of 10 m s–1. (right) the same for SSP3-7.0 for 31 models. {2.3.1; Figures 2.12 and 2.18; 4.5.1; Figure 4.2.6}