Back chapter figures
Figure TS.11
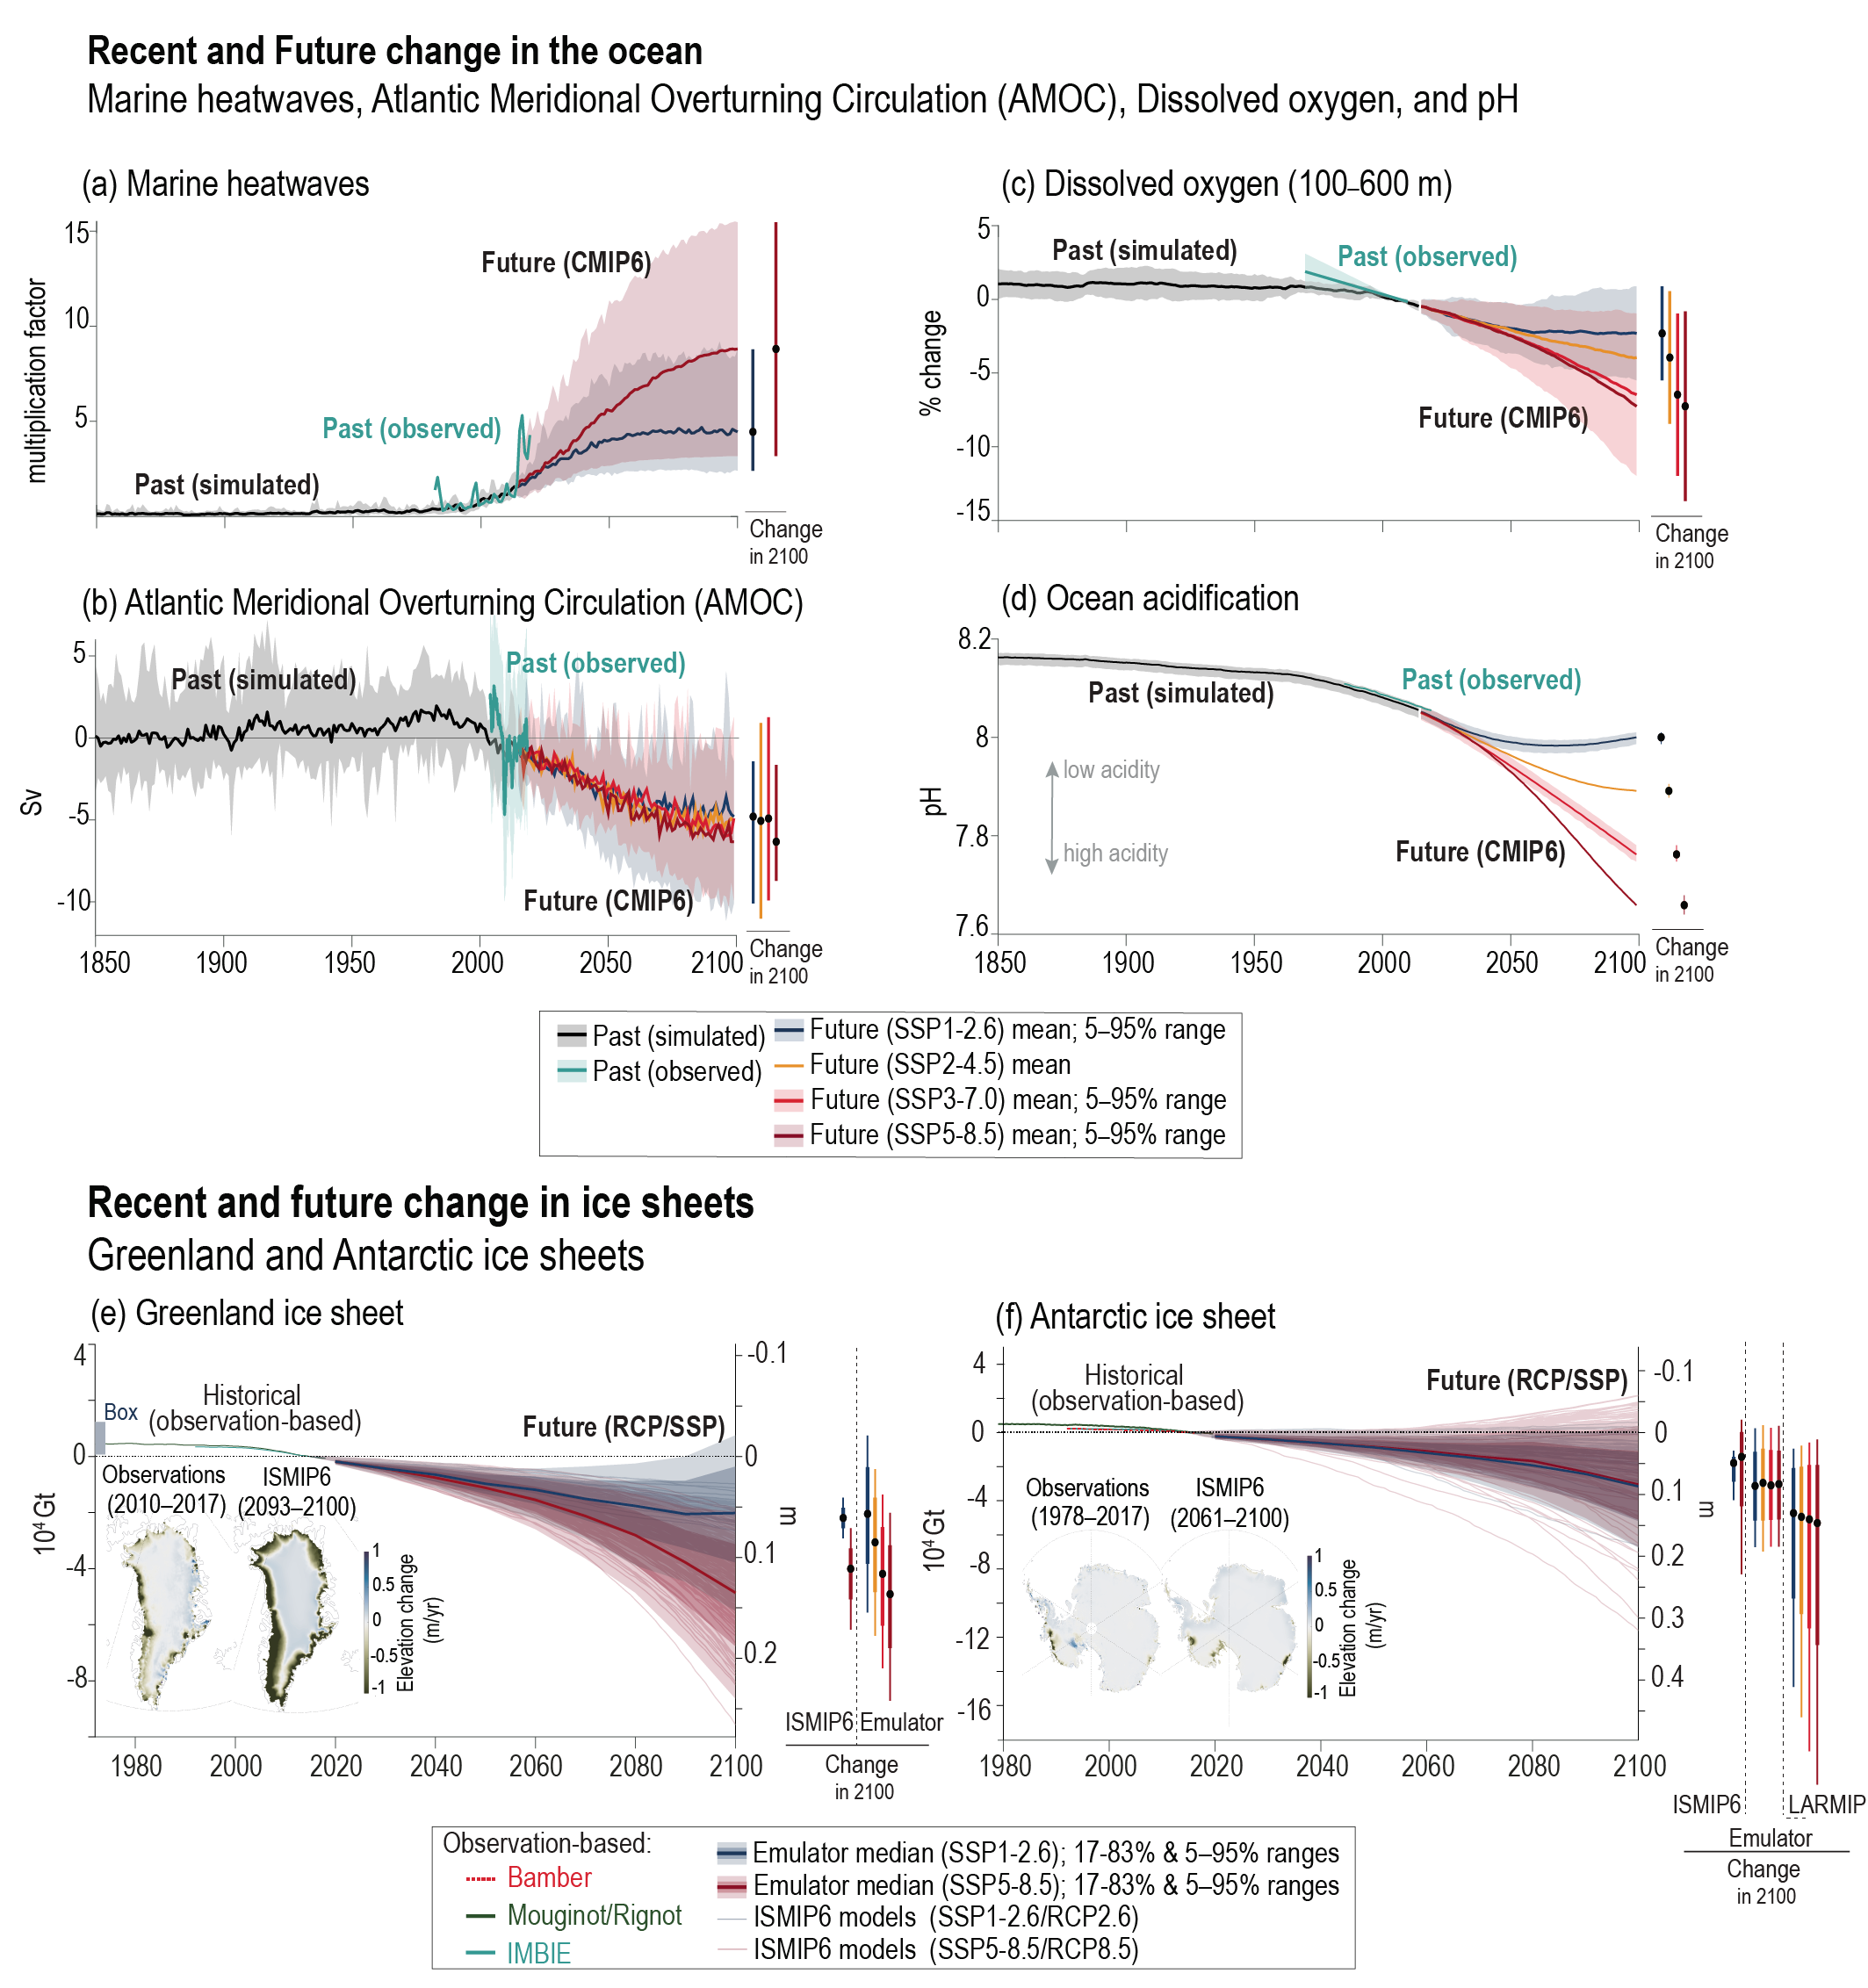
Figure caption
Figure TS.11 | Past and future ocean and ice-sheet changes. The intent of this figure is to show that observed and projected time series of many ocean and cryosphere indicators are consistent. Observed and simulated historical changes and projected future changes under varying greenhouse gas emissions scenarios. Simulated and projected ocean changes are shown as Coupled Model Intercomparison Project Phase 6 (CMIP6) ensemble mean, and 5–95% range (shading) is provided for scenarios SSP1-2.6 and SSP3-7.0 (except in panel a where the range is provided for scenario SSP1-2.6 and SSP5-8.5). Mean and 5–95%range in 2100 are shown as vertical bars on the right-hand side of each panel. (a) Change in multiplication factor in surface ocean marine heatwave days relative to 1995–2014 (defined as days exceeding the 99th percentile in sea surface temperature (SST) from 1995–2014 distribution). Assessed observational change span 1982–2019 from AVHRR satellite SST. (b) Atlantic Meridional Overturning Circulation (AMOC) transport relative to 1995–2014 (defined as maximum transport at 26°N). Assessed observational change spans 2004–2018 from the RAPID array smoothed with a 12-month running mean (shading around the mean shows the 12-month running standard deviation around the mean). (c) Global mean percent change in ocean oxygen (100–600 m depth), relative to 1995–2014. Assessed observational trends and very likely range are from the SROCC assessment, and span 1970–2010 centred on 2005. (d) Global mean surface pH. Assessed observational change spans 1985–2019, from the CMEMS SOCAT-based reconstruction (shading around the global mean shows the 90% confidence interval). (e), (f): Ice sheet mass changes. Projected ice-sheet changes are shown as median, 5–95% range (light shading), and 17–83% range (dark shading) of cumulative mass loss and sea level equivalent from ISMIP6 emulation under SSP1-2.6 and SSP5-8.5 (shading and bold line), with individual emulated projections as thin lines. Median (dot), 17–83% range (thick vertical bar), and 5–95% range (thin vertical bar) in 2100 are shown as vertical bars on the right-hand side of each panel, from ISMIP6, ISMIP6 emulation, and LARMIP-2. Observation-based estimates: For Greenland (e), for 1972–2018 (Mouginot), for 1992–2016 (Bamber), for 1992–2020 (IMBIE) and total estimated mass loss range for 1840–1972 (Box). For Antarctica (f), estimates based on satellite data combined with simulated surface mass balance and glacial isostatic adjustment for 1992–2020 (IMBIE), 1992–2016 (Bamber), and 1979–2017 (Rignot). Left inset maps: mean Greenland elevation changes 2010–2017 derived from CryoSat-2 radar altimetry (e) and mean Antarctica elevation changes 1978–2017 derived from restored analogue radar records (f). Right inset maps: ISMIP6 model mean (2093–2100) projected changes under the MIROC5 climate model for the RCP8.5 scenario. {2.3.3; 2.3.4; 3.5.4; 4.3.2; 5.3.2; 5.3.3; 5.6.3; 9.2.3; 9.4.1; 9.4.2; Box 9.2; Box 9.2, Figure 1; Figures 9.10, 9.17 and 9.18}