Back chapter figures
Figure TS.13
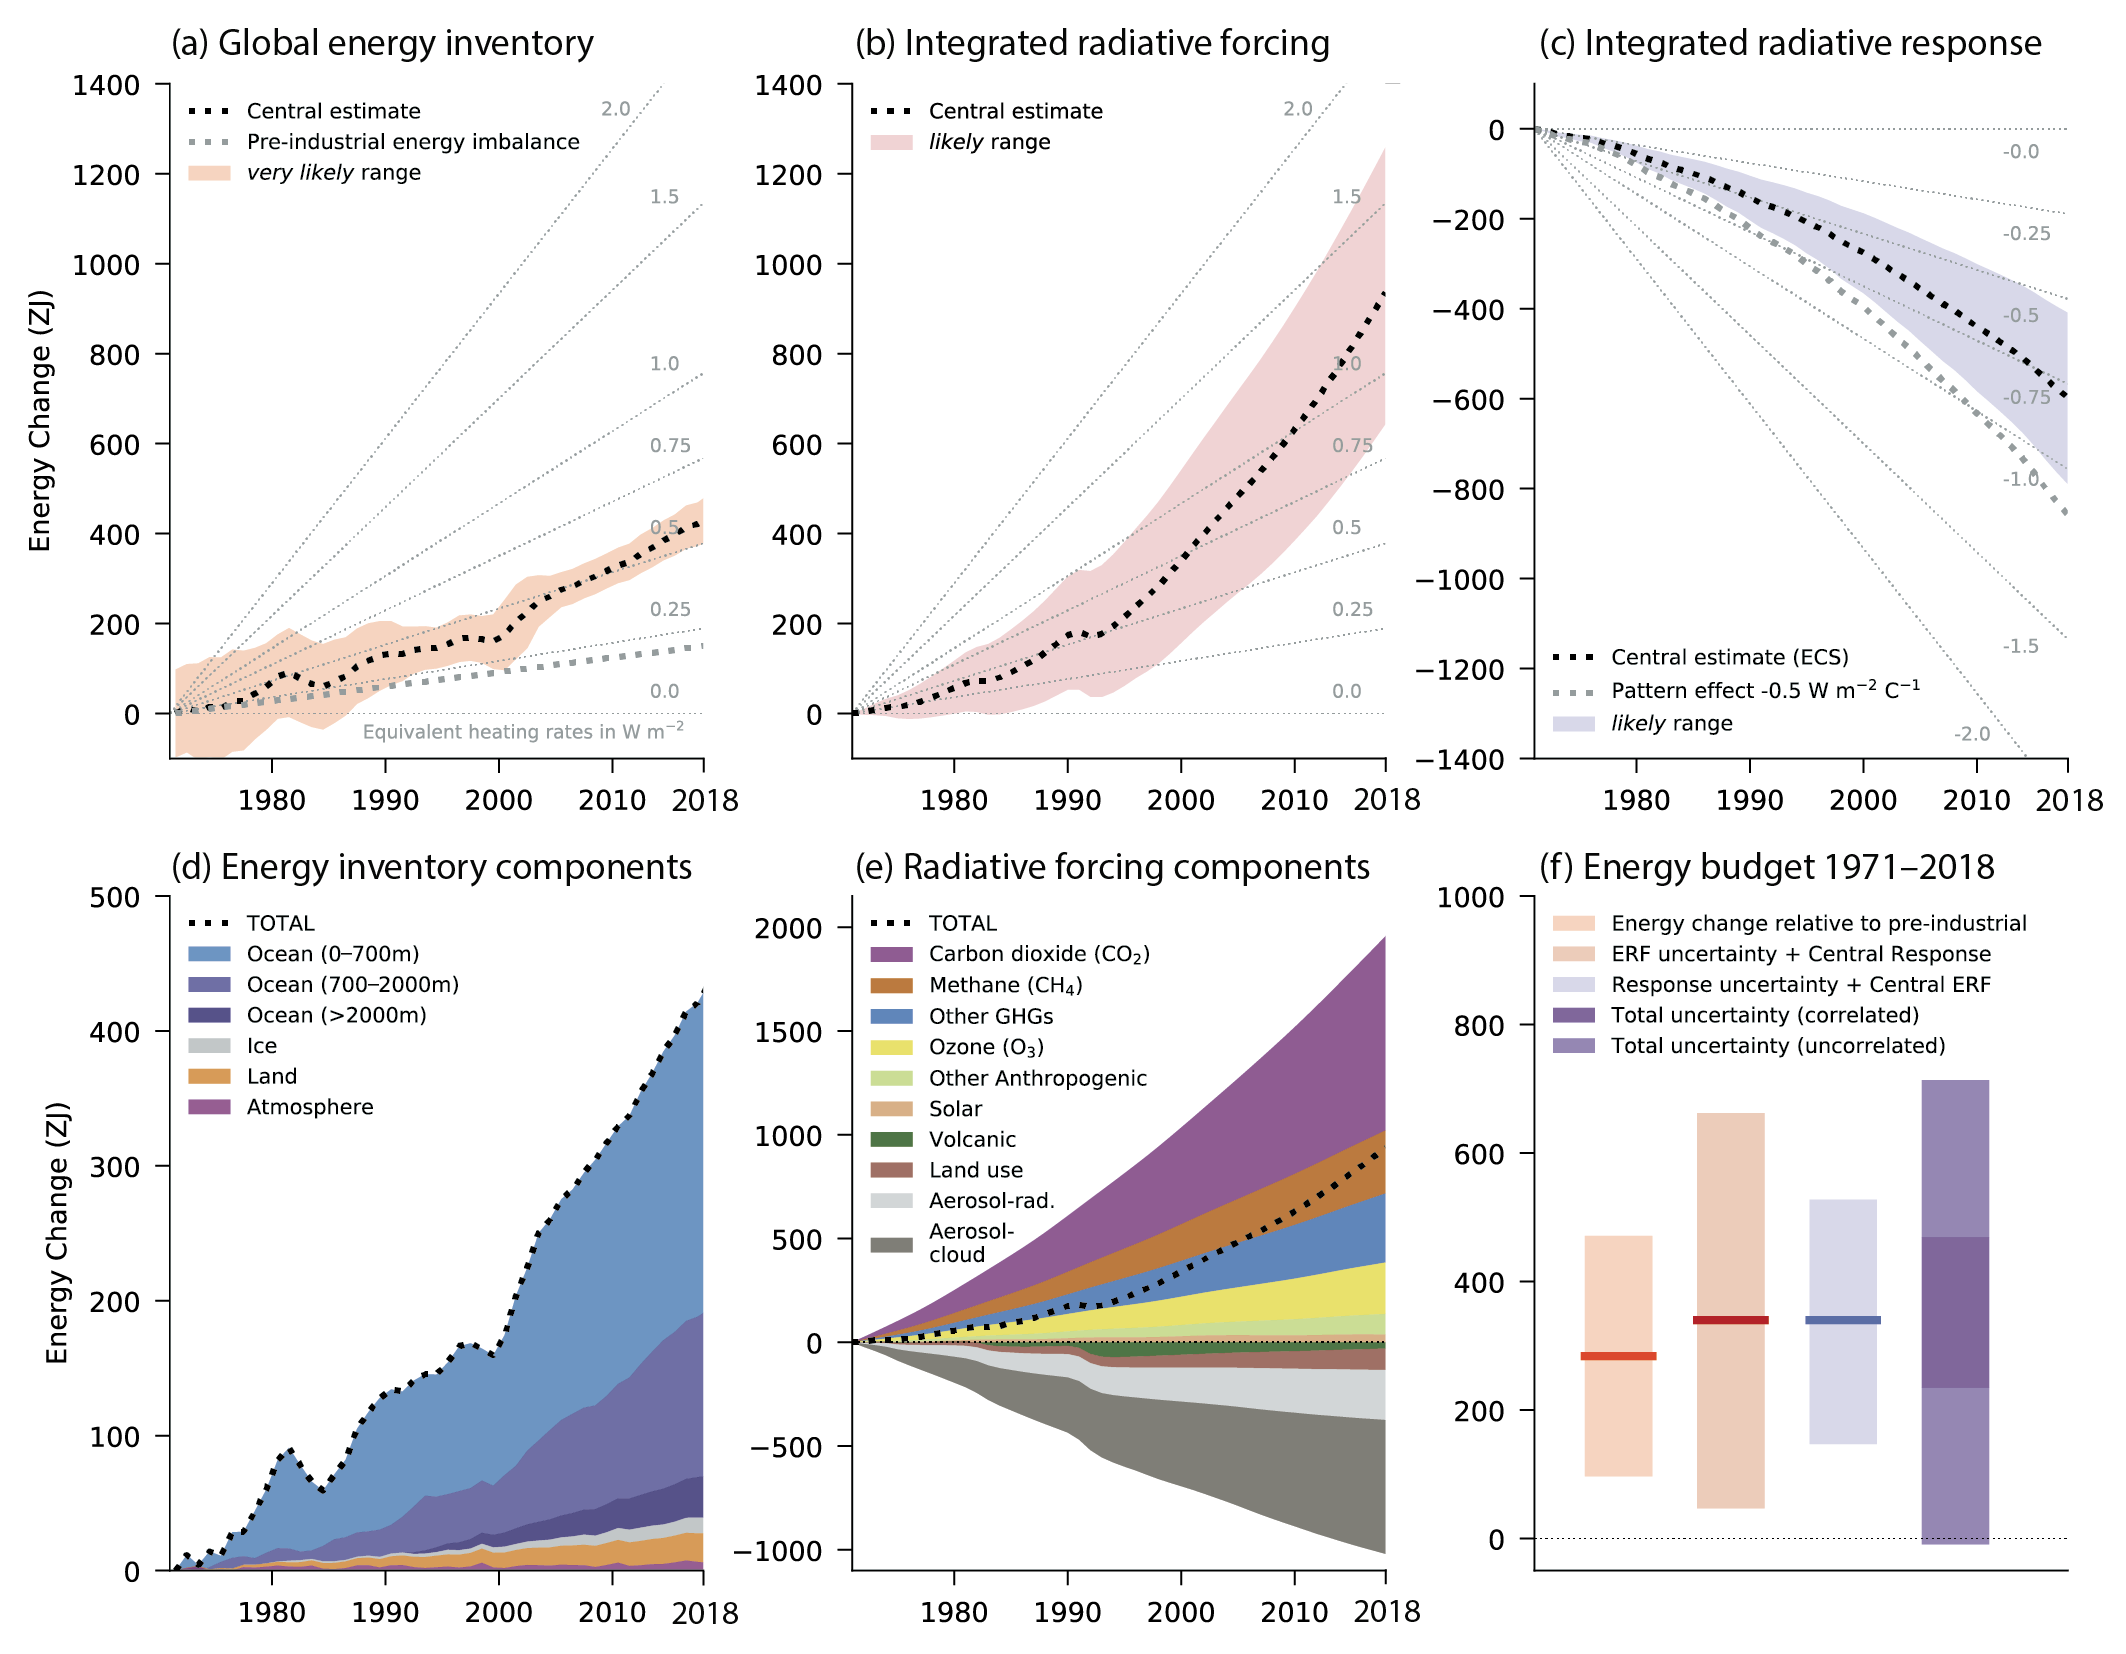
Figure caption
Figure TS.13 | Estimates of the net cumulative energy change (ZJ = 1021Joules) for the period 1971–2018 associated with (a) observations of changes in the global energy inventory, (b) integrated radiative forcing, and (c) integrated radiative response. The intent is to show assessed changes in energy budget and effective radiative forcings (ERFs). Black dotted lines indicate the central estimate with likely and very likely ranges as indicated in the legend. The grey dotted lines indicate the energy change associated with an estimated 1850–1900 Earth energy imbalance of 0.2 W m–2 (panel a) and an illustration of an assumed pattern effect of –0.5 W m–2°C–1 (panel c). Background grey lines indicate equivalent heating rates in W m–2 per unit area of Earth’s surface. Panels (d) and (e) show the breakdown of components, as indicated in the legend, for the global energy inventory and integrated radiative forcing, respectively. Panel (f) shows the global energy budget assessed for the period 1971–2018, that is, the consistency between the change in the global energy inventory relative to 1850–1900 and the implied energy change from integrated radiative forcing plus integrated radiative response under a number of different assumptions, as indicated in the figure legend, including assumptions of correlated and uncorrelated uncertainties in forcing plus response. Shading represents the very likely range for observed energy change relative to 1850–1900 and likely range for all other quantities. Forcing and response time series are expressed relative to a baseline period of 1850–1900. {Box 7.2, Figure 1}