Back chapter figures
Figure TS.15
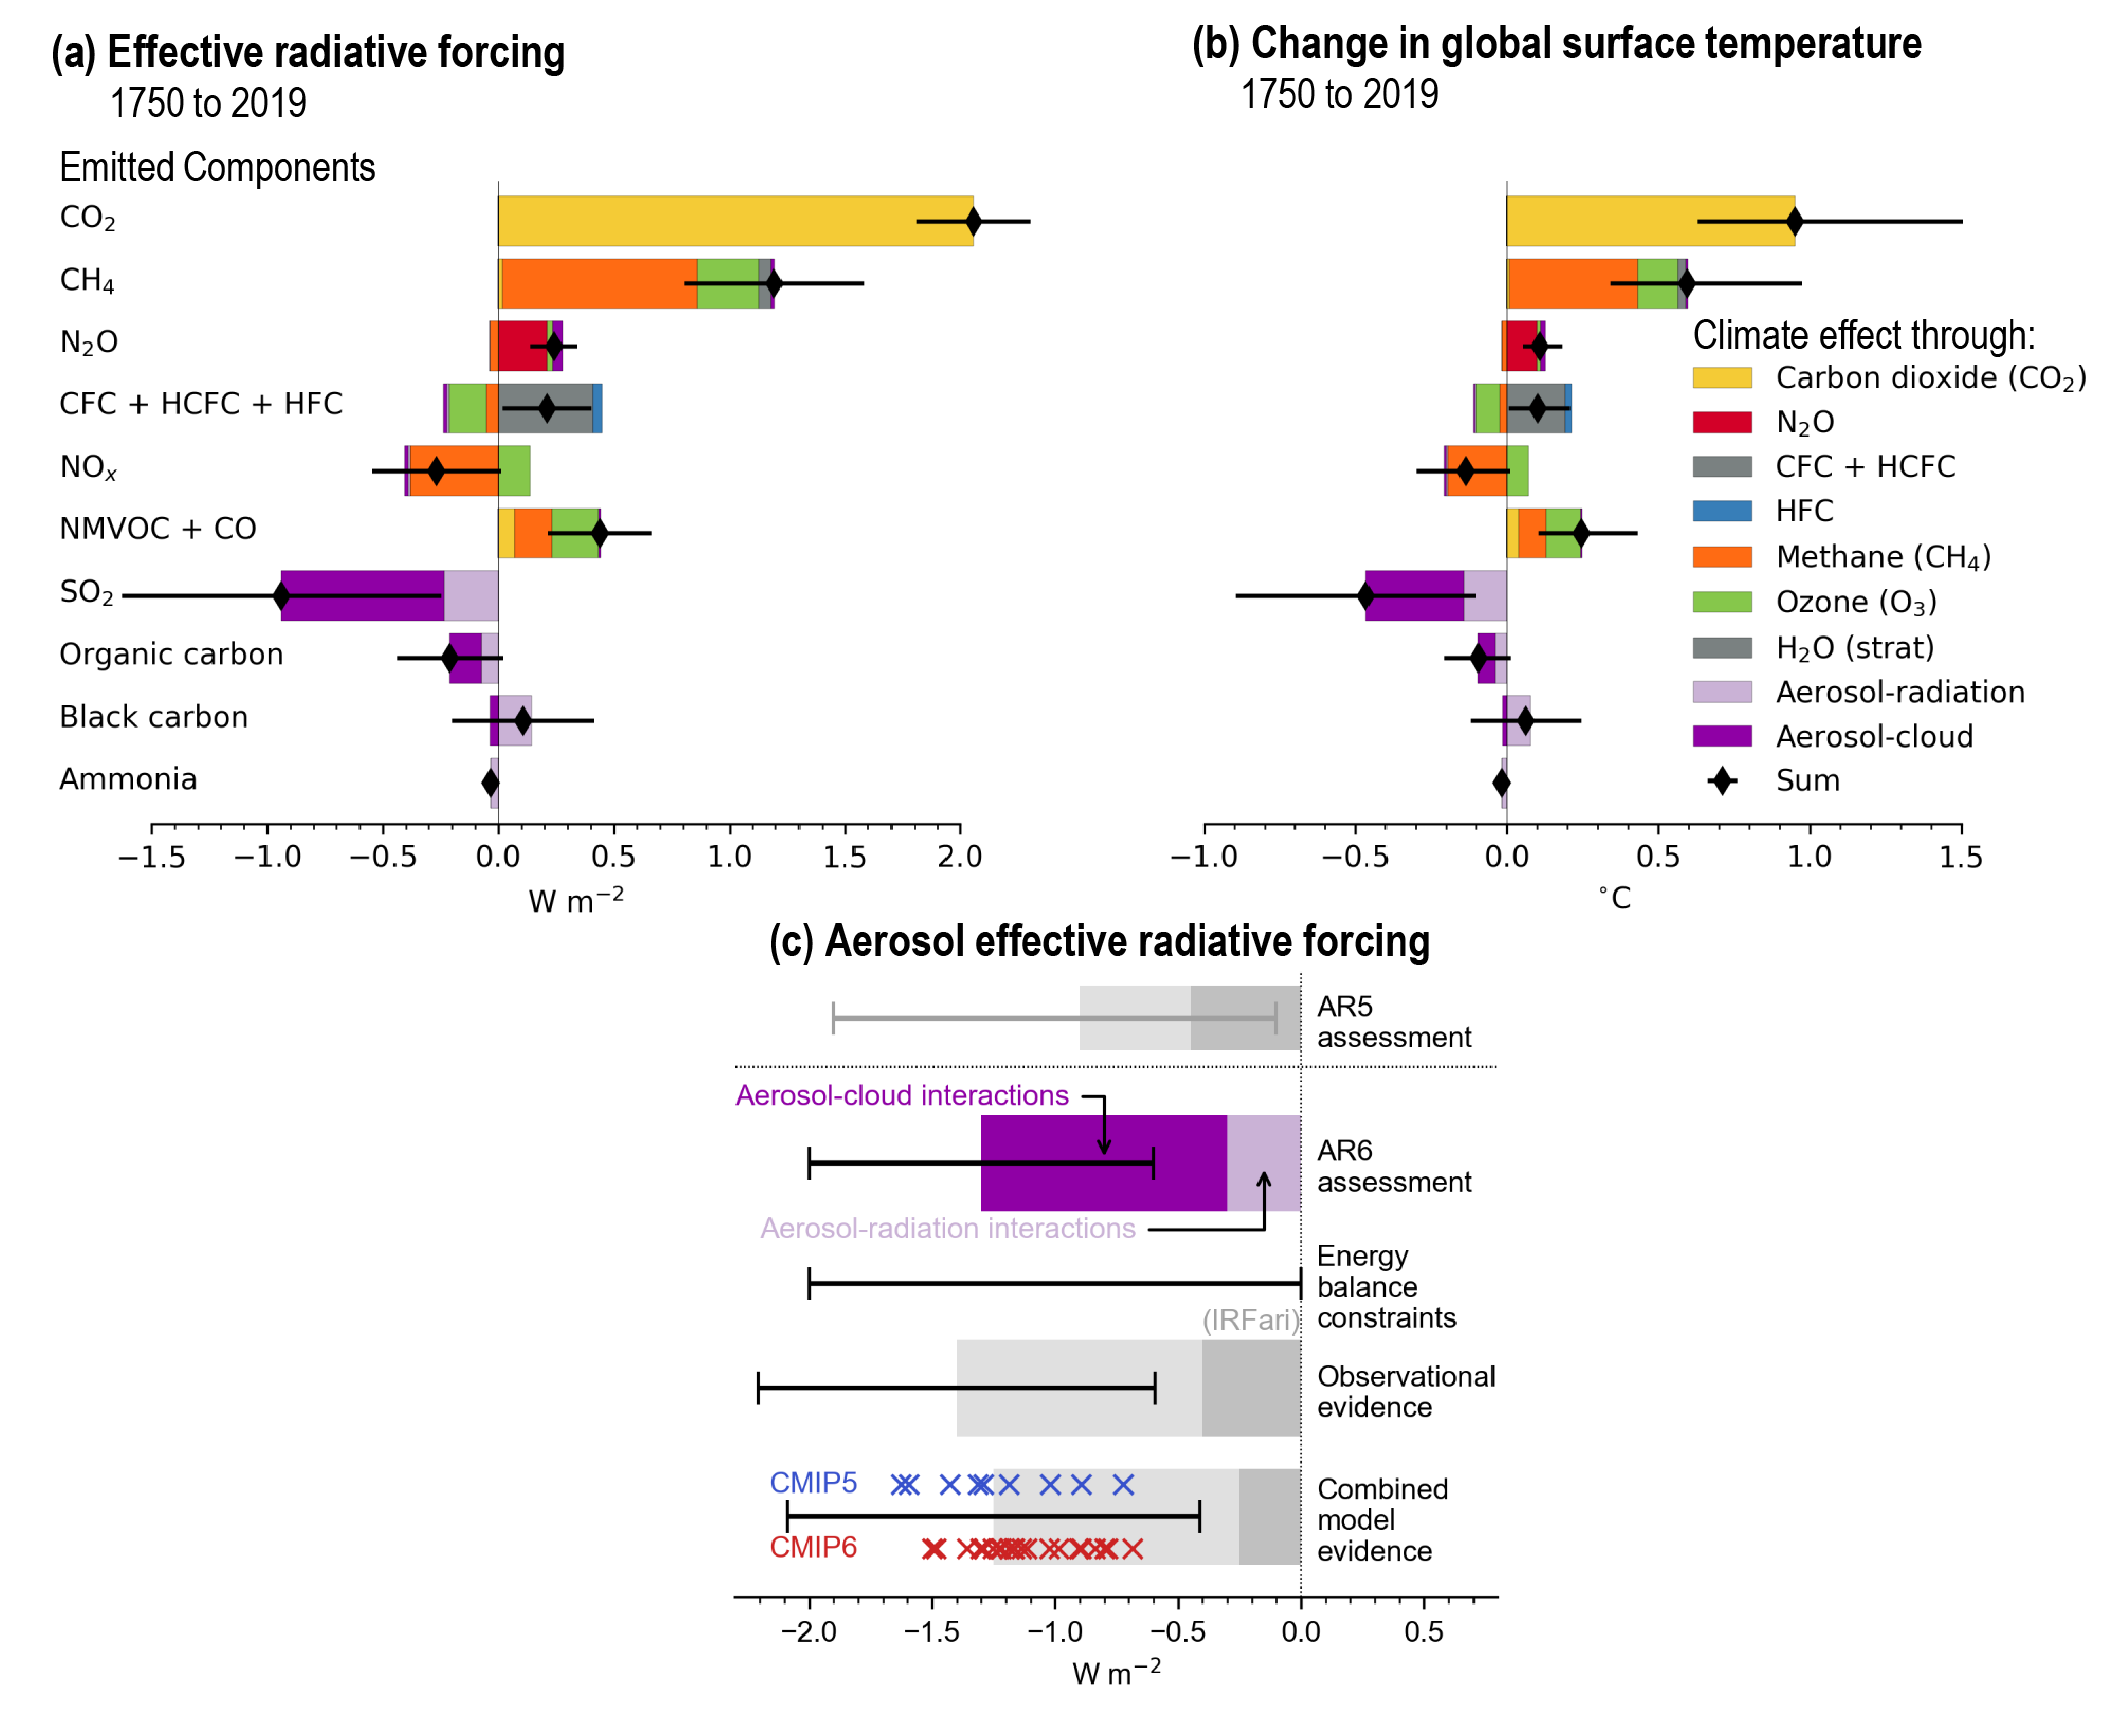
Figure caption
Figure TS.15 | Contribution to (a) effective radiative forcing (ERF) and (b) global surface temperature change from component emissions for1750–2019based on Coupled Model Intercomparison Project Phase 6 (CMIP6) models and (c) net aerosol ERF for 1750–2014 from different lines of evidence. The intent of this figure is to show advances since AR5 in the understanding of (a) emissions-based ERF, (b) global surface temperature response forshort-livedclimate forcers as estimated in Chapter 6, and (c) aerosol ERF from different lines of evidence as assessed in Chapter 7. In panel (a), ERFs for well-mixed greenhouse gases (WMGHGs) are from the analytical formulae. ERFs for other components are multi-model means based on Earth system model simulations that quantify the effect of individual components. The derived emissions-based ERFs are rescaled to match the concentration-based ERFs in Figure 7.6. Error bars are 5–95% and for the ERF account for uncertainty in radiative efficiencies and multi-model error in the means. In panel (b), the global mean temperature response is calculated from the ERF time series using an impulse response function. In panel (c), the AR6 assessment is based on energy balance constraints, observational evidence from satellite retrievals, and climate model-based evidence. For each line of evidence, the assessed best-estimate contributions from ERF due to aerosol–radiation interactions (ERFari) and aerosol–cloud interactions (ERFaci) are shown with darker and paler shading, respectively. Estimates from individual CMIP Phase 5 (CMIP5) and CMIP6 models are depicted by blue and red crosses, respectively. The observational assessment for ERFari is taken from the instantaneous forcing due to aerosol–radiation interactions (IRFari). Uncertainty ranges are given in black bars for the total aerosol ERF and depictvery likely ranges. {6.4.2, Figure 6.12, 7.3.3, Cross-Chapter Box 7.1, Table 7.8, Figure 7.5}