Back chapter figures
Figure TS.2
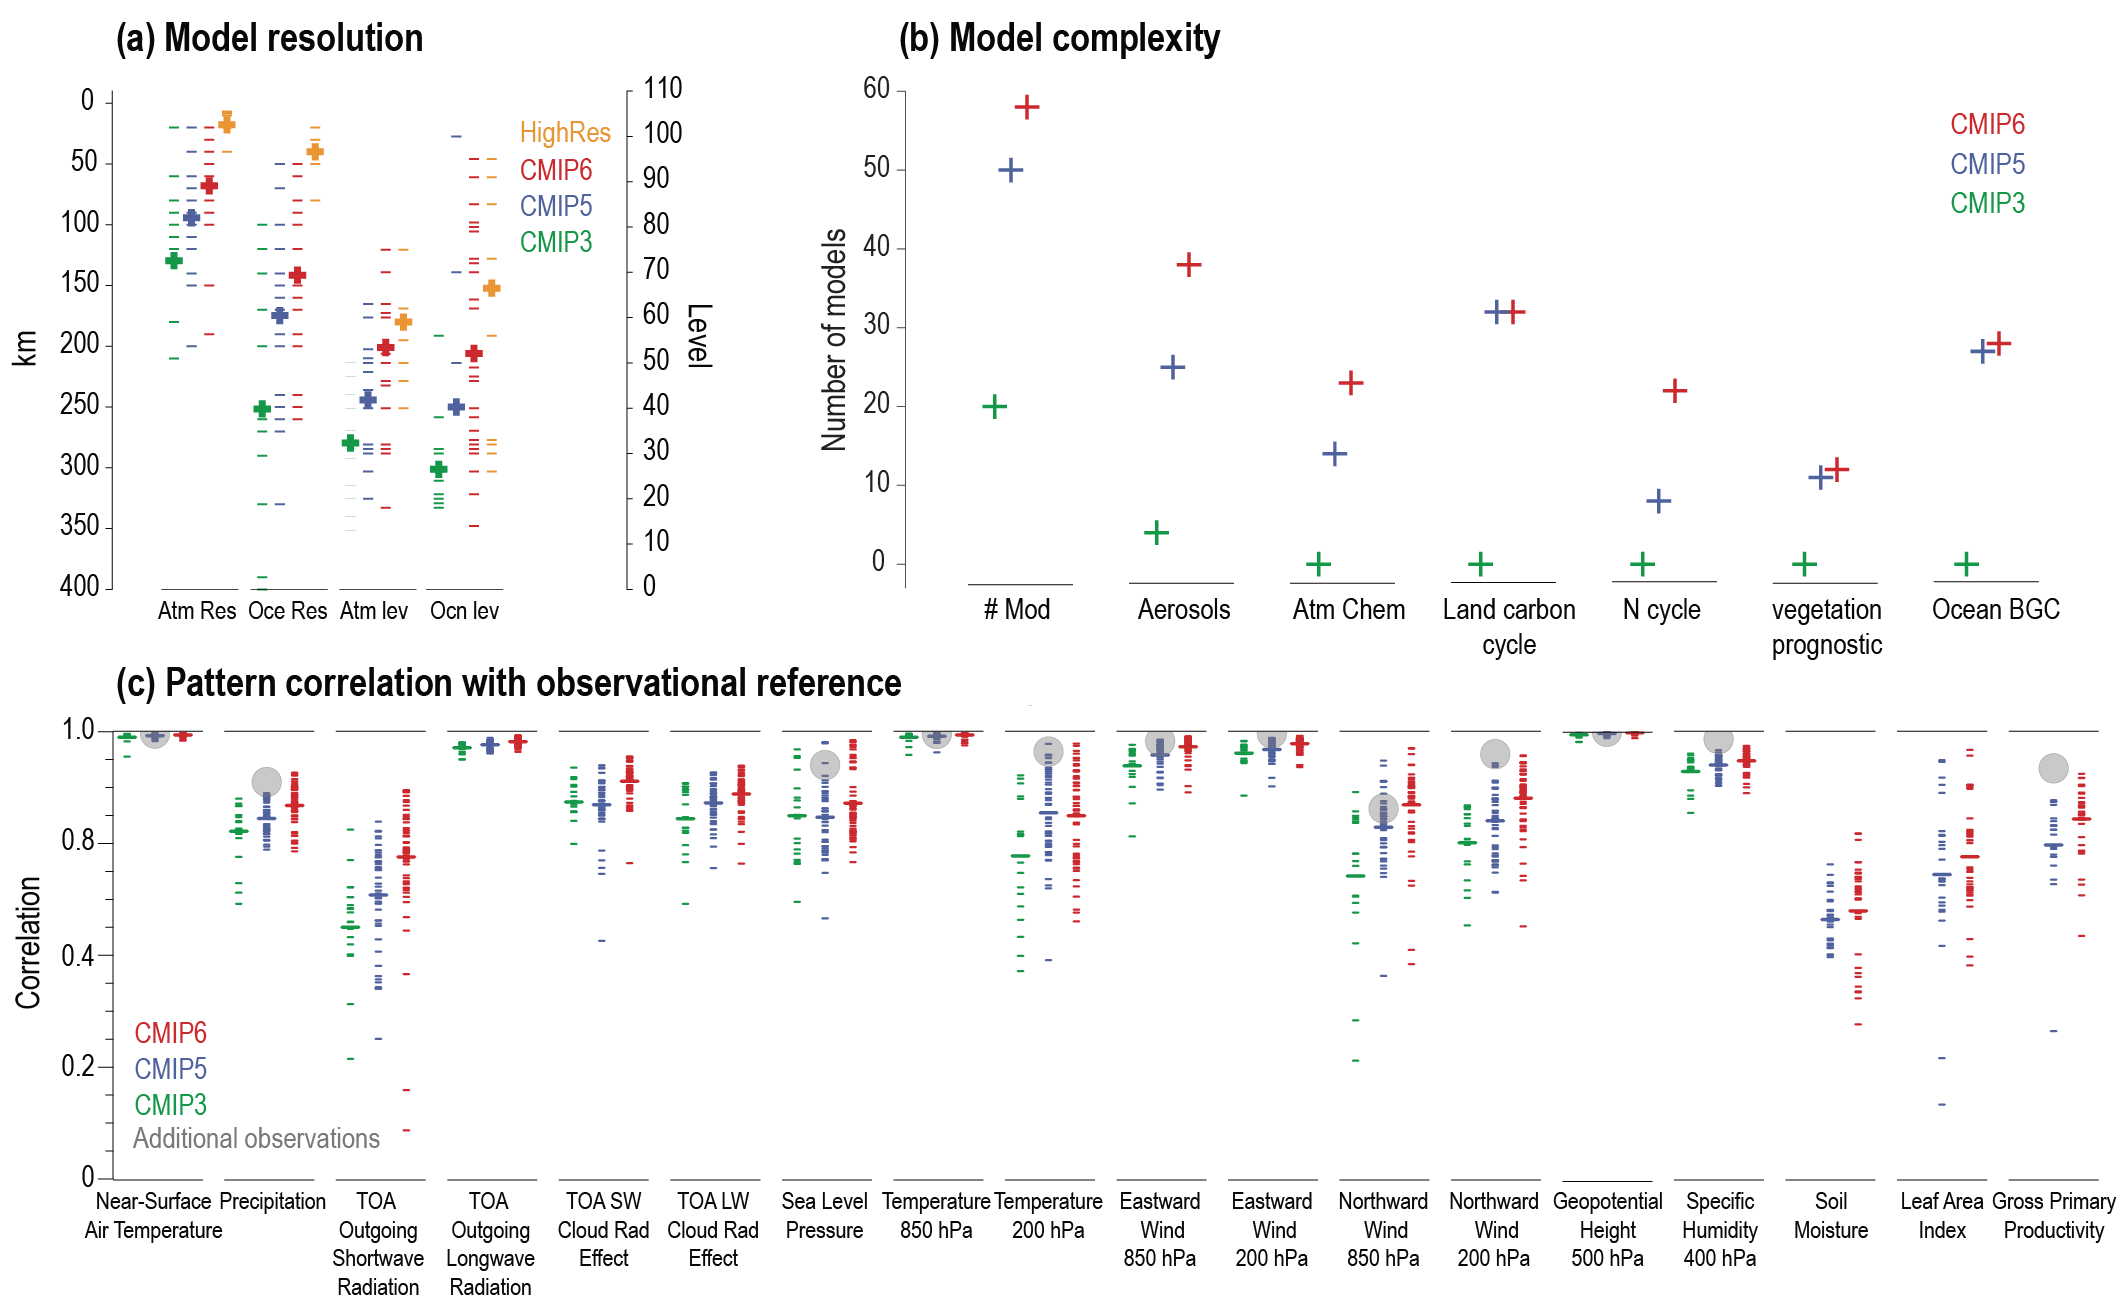
Figure caption
Figure TS.2 | Progress in climate models. The intent of this figure is to show present improvements in climate models in resolution, complexity and representation of key variables. (a) Evolution of model horizontal resolution and vertical levels (based on Figure 1.19). (b) Evolution of inclusion of processes and resolution from Coupled Model Intercomparison Project Phase 3 (CMIP3), Phase 5 (CMIP5) and Phase 6 (CMIP6; Annex II). (c) Centred pattern correlations between models and observations for the annual mean climatology over the period 1980–1999. Results are shown for individual CMIP3 (cyan), CMIP5 (blue) and CMIP6 (red) models (one ensemble member is used) as short lines, along with the corresponding ensemble averages (long lines). The correlations are shown between the models and the primary reference observational data set (from left to right: ERA5, GPCP-SG, CERES-EBAF, CERES-EBAF, CERES-EBAF, CERES-EBAF, JR-55, ERA5, ERA5, ERA5, ERA5, ERA5, ERA5, AIRS, ERA5, ESACCI-Soilmoisture, LAI3g, MTE). In addition, the correlation between the primary reference and additional observational data sets (from left to right: NCEP, GHCN, -, -, -, -, ERA5, HadISST, NCEP, NCEP, NCEP, NCEP, NCEP, NCEP, ERA5, NCEP, -, -, FLUXCOM) are shown (solid grey circles) if available. To ensure a fair comparison across a range of model resolutions, the pattern correlations are computed after regridding all datasets to a resolution of 4º in longitude and 5º in latitude. (Expanded from Figure 3.43; produced with ESMValTool version 2). {Figure 3.43}