Back chapter figures
Figure TS.21
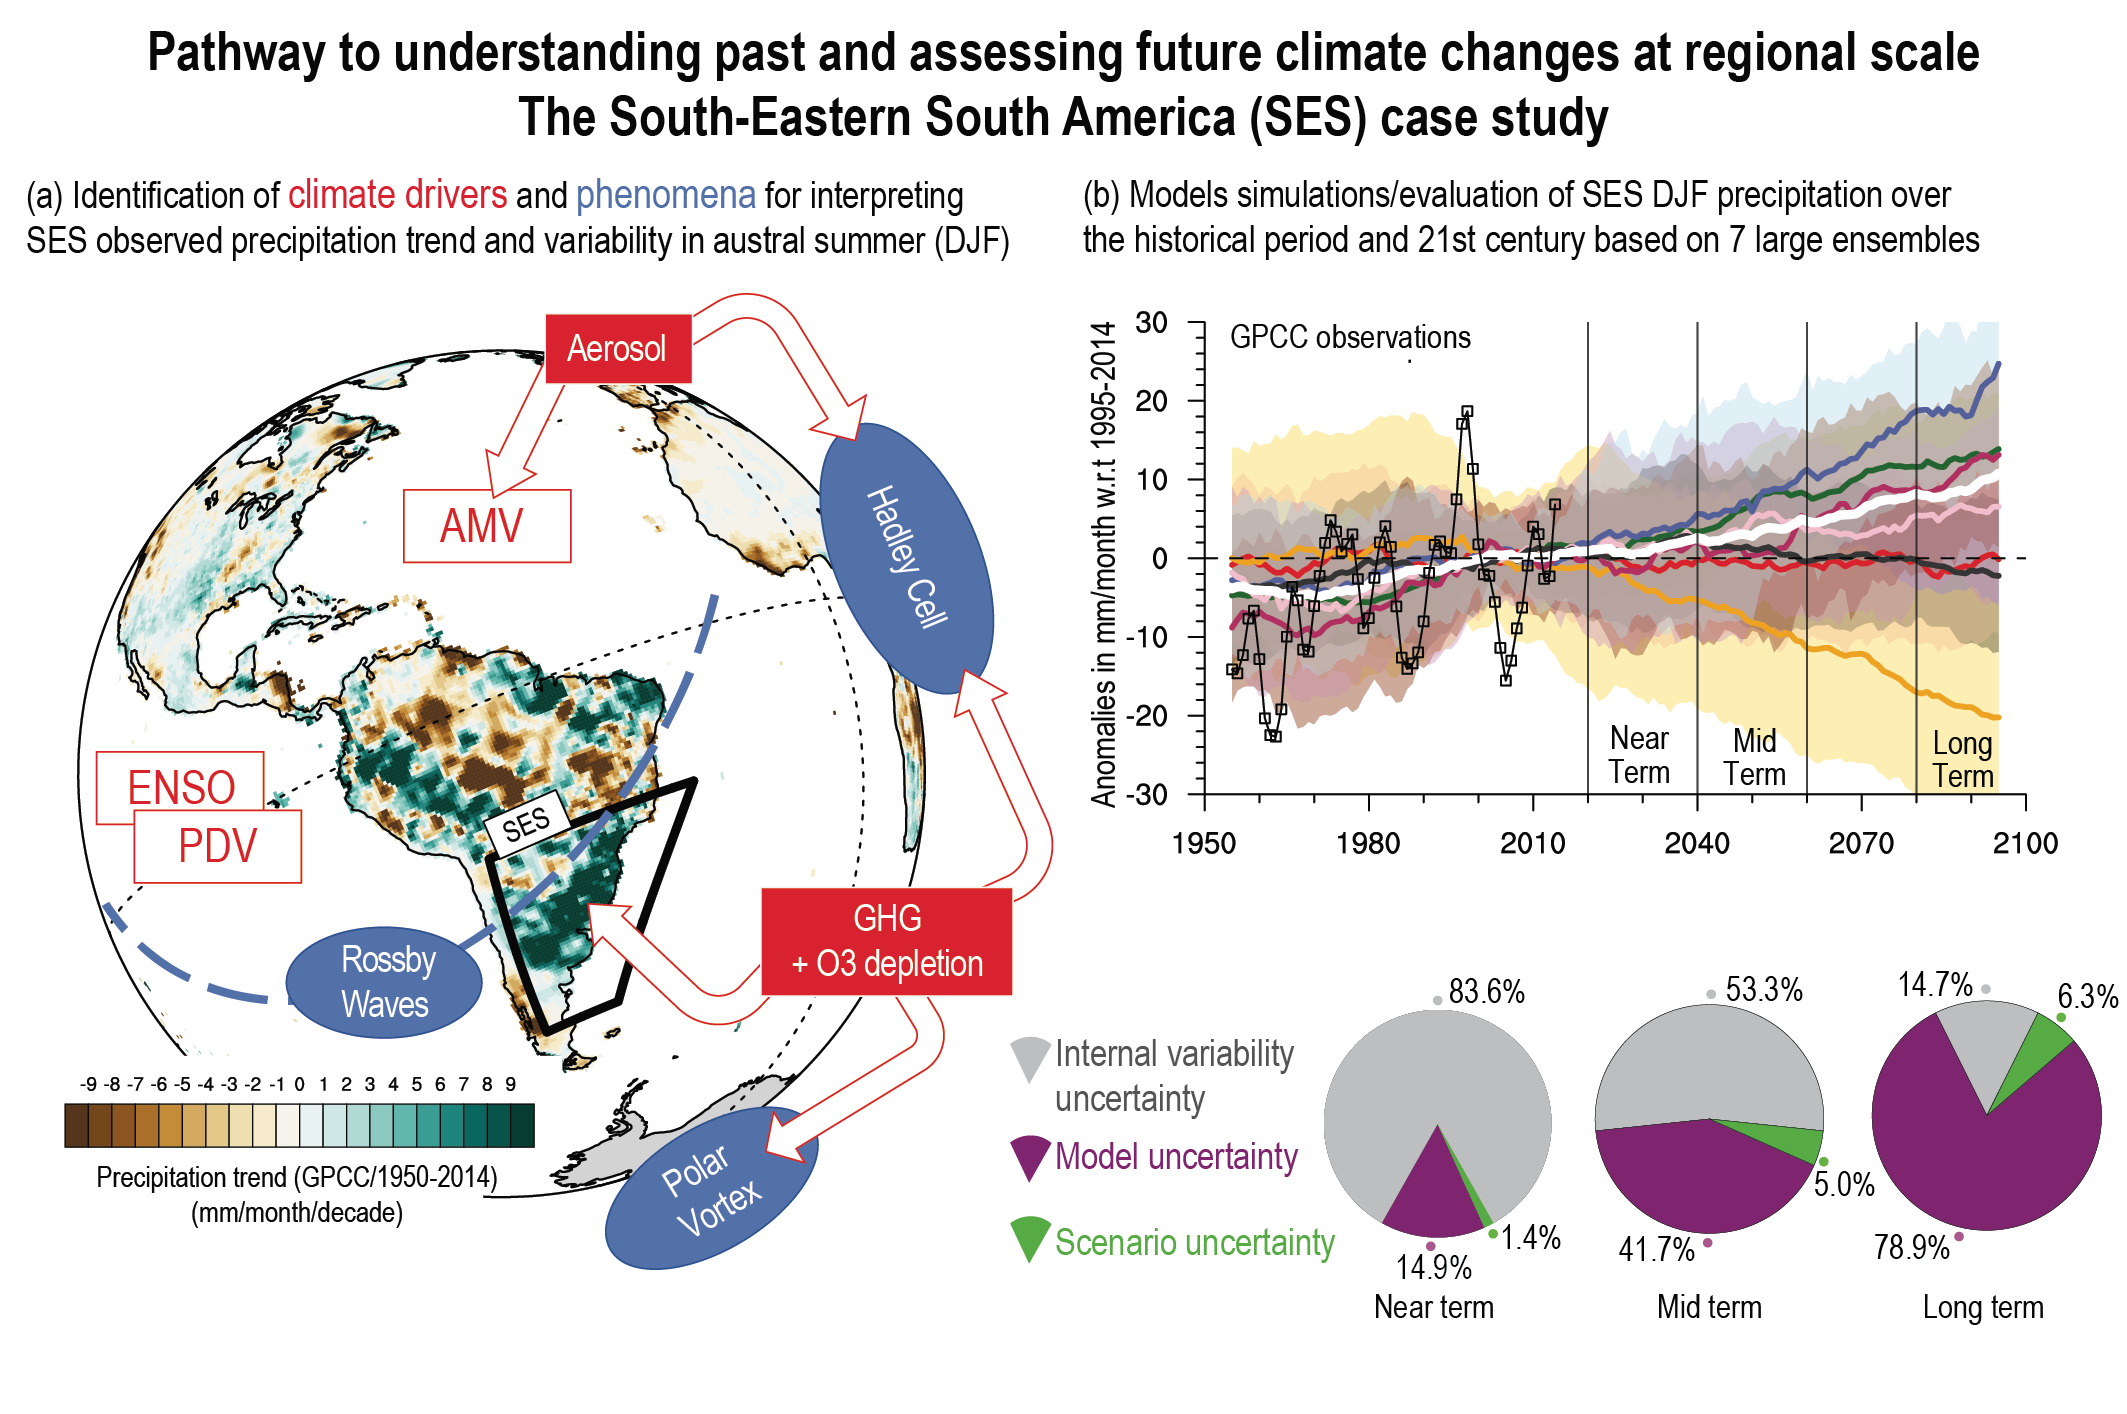
Figure caption
Figure TS.21 | Example of the interplay between drivers of climate variability and change at regional scale to understand past and projected changes. The figure intent is to show an illustrative pathway for understanding past, and anticipating future, climate change at regional scale in the presence of uncertainties. (a) Identification of the climate drivers and their influences on climate phenomena contributing through teleconnection to South-Eastern South America (SES) summer (December–January–February; DJF) precipitation variability and trends observed over 1950–2014. Drivers (red squares) include modes of variability as well as external forcing. Observed precipitation linear trend from GPCC is shown on continents (green-brown colour bar in mm month–1 per decade) and the SES AR6 WGI reference region is outlined with the thick black contour. Climate phenomena leading to local effects on SES are schematically presented (blue ovals). (b) Time series of decadal precipitation anomalies for DJF SES simulated from seven large ensembles of historical plus RCP8.5 simulations over 1950–2100. Shading corresponds to the 5–95th range of climate outcomes given from each large ensemble for precipitation (in mm month–1) and thick coloured lines stand for their respective ensemble mean. The thick time series in white corresponds to the multi-model multi-member ensemble mean, with model contribution being weighted according to their ensemble size. GPCC observation is shown in the light black line with squares over 1950–2014, and the 1995–2014 baseline period has been retained for calculation of anomalies in all datasets. (c) Quantification of the respective weight (in percent) between the individual sources of uncertainties (internal in grey, model in magenta and scenario in green) at near-term, mid-term and long-term temporal windows defined in AR6 and highlighted in (b) for SES DJF precipitation. All computations are done with respect to 1995–2014, taken as the reference period, and the scenario uncertainty is estimated from Coupled Model Intercomparison Project Phase 5 (CMIP5) using the same set of models as for the large ensembles that have run different Representative Concentration Pathway (RCP) scenarios. {Figure 10.12a}