Figure TS.22
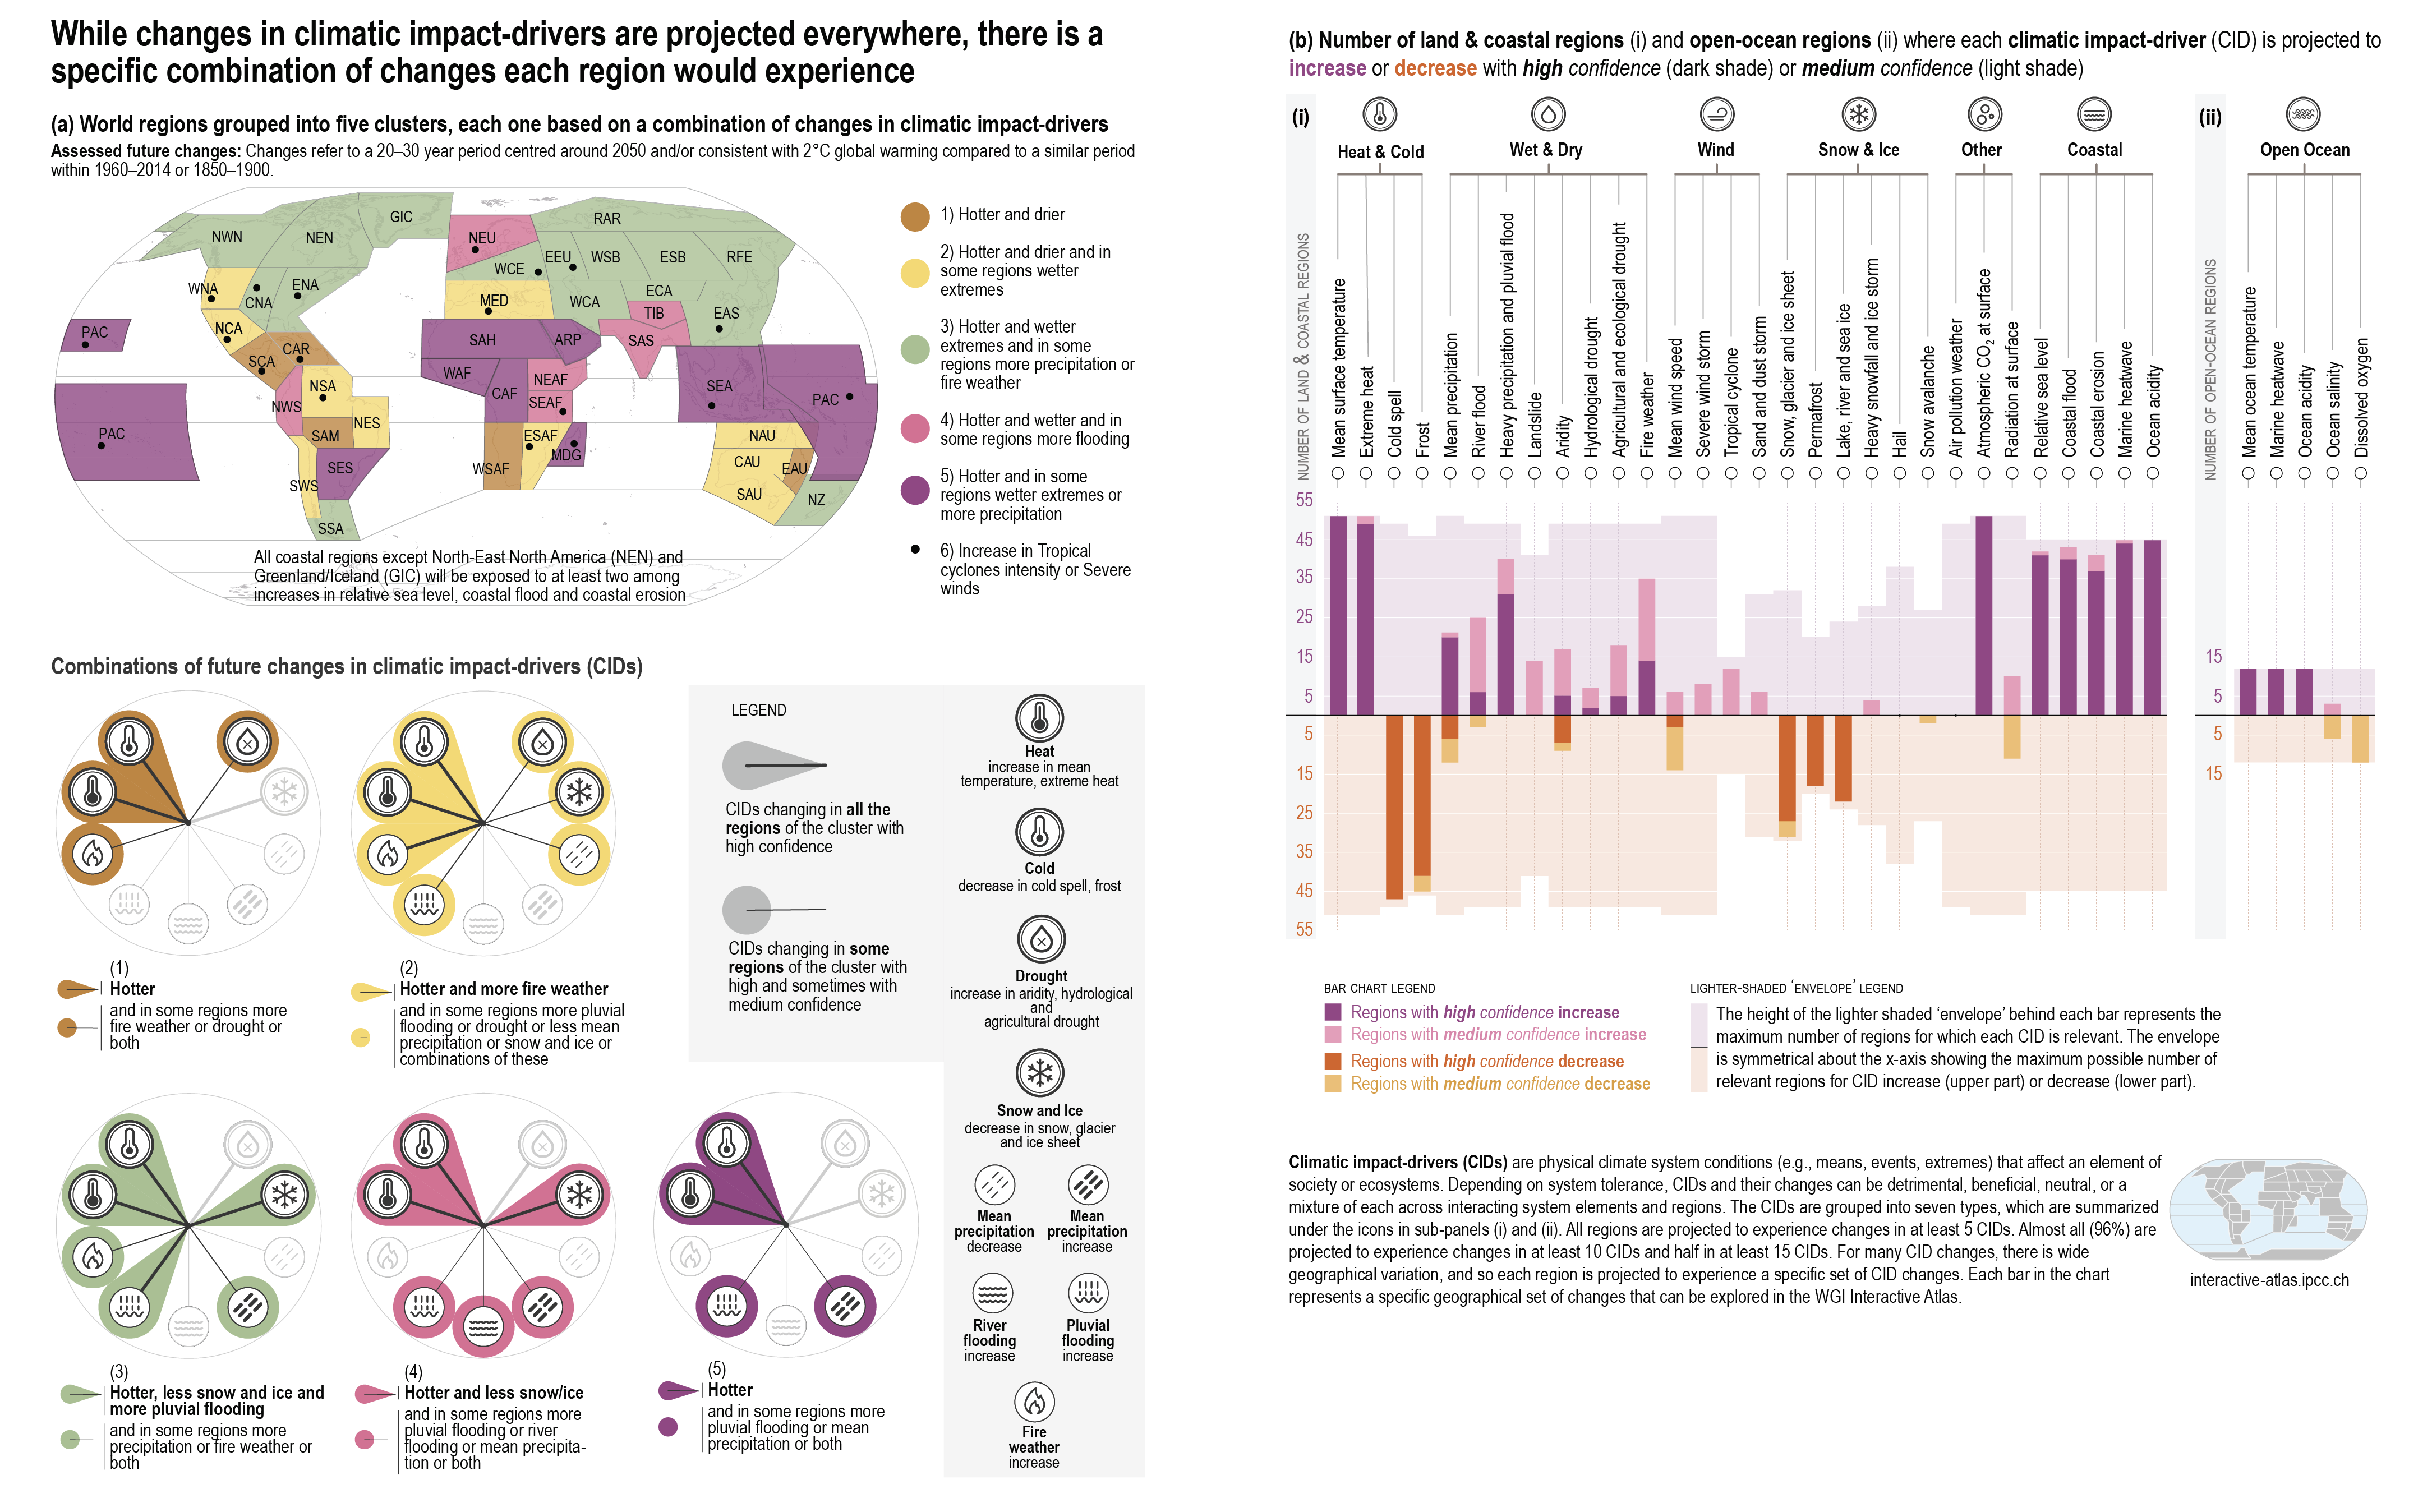
Figure caption
Panel (a) shows the geographical location of regions belonging to one of five groups characterized by a specific combination of changing climatic impact-drivers (CIDs). The five groups are represented by the five different colours, and the CID combinations associated with each group are represented in the corresponding ‘fingerprint’ and text below the map. Each fingerprint comprises a set of CIDs projected to change with high confidence in every region in the group and a second set of CIDs, one or more of which are projected to change in each region with highormedium confidence. The CID combinations follow a progression from those becoming hotter and drier (group 1) to those becoming hotter and wetter (group 5). In between (groups 2–4), the CIDs that change include some becoming drier and some wetter and always include a set of CIDs which are getting hotter. Tropical cyclones and severe wind CID changes are represented on the map with black dots in the regions affected. Regions affected by coastal CID changes are described by text on the map. The five groups are chosen to provide a reasonable level of detail for each region while not overwhelming the map with a full summary of all aspects of the assessment, which is available in Table TS.5 and can be visualized in the Regional Synthesis component of the Interactive Atlas. The CID changes summarized in the figure represent high and medium confidence changes for the mid-21st century, considering scenarios SSP2-4.5, RCP4.5, SRES A1B, or above (SSP3-7.0, SSP5-8.5, RCP6.0, RCP8.5, SRES A2), which approximately encompasses global warming levels of 2.0°C to 2.4°C.
The bar chart in panel (b) shows the numbers of regions where each CID is increasing or decreasing with mediumor high confidence for all land regions and ocean regions listed in Table TS.5. The colours represent the direction of change and the level of confidence in the change: purple indicates an increase while brown indicates a decrease; darker and lighter shades refer to high and medium confidence, respectively. Lighter background colours represent the maximum number of regions for which each CID is broadly relevant. Sub-panel (i) shows the 30 CIDs relevant to the land and coastal regions while sub-panel (ii) shows the 5 CIDs relevant to the open ocean regions. Marine heatwaves and ocean acidity are assessed for coastal ocean regions in panel (i) and for open ocean regions in panel (ii). Changes refer to a 20- to 30-year period centred around 2050 and/or consistent with 2°C global warming compared to a similar period within 1960–2014, except for hydrological drought and agricultural and ecological drought, which is compared to 1850–1900. Definitions of the regions are provided in Atlas.1, the Interactive Atlas (https://interactive-atlas.ipcc.ch/) and Chapter 12. (Table TS.5, Figure TS.24) {11.9, 12.2, 12.4, Atlas.1}