Back chapter figures
Figure TS.23
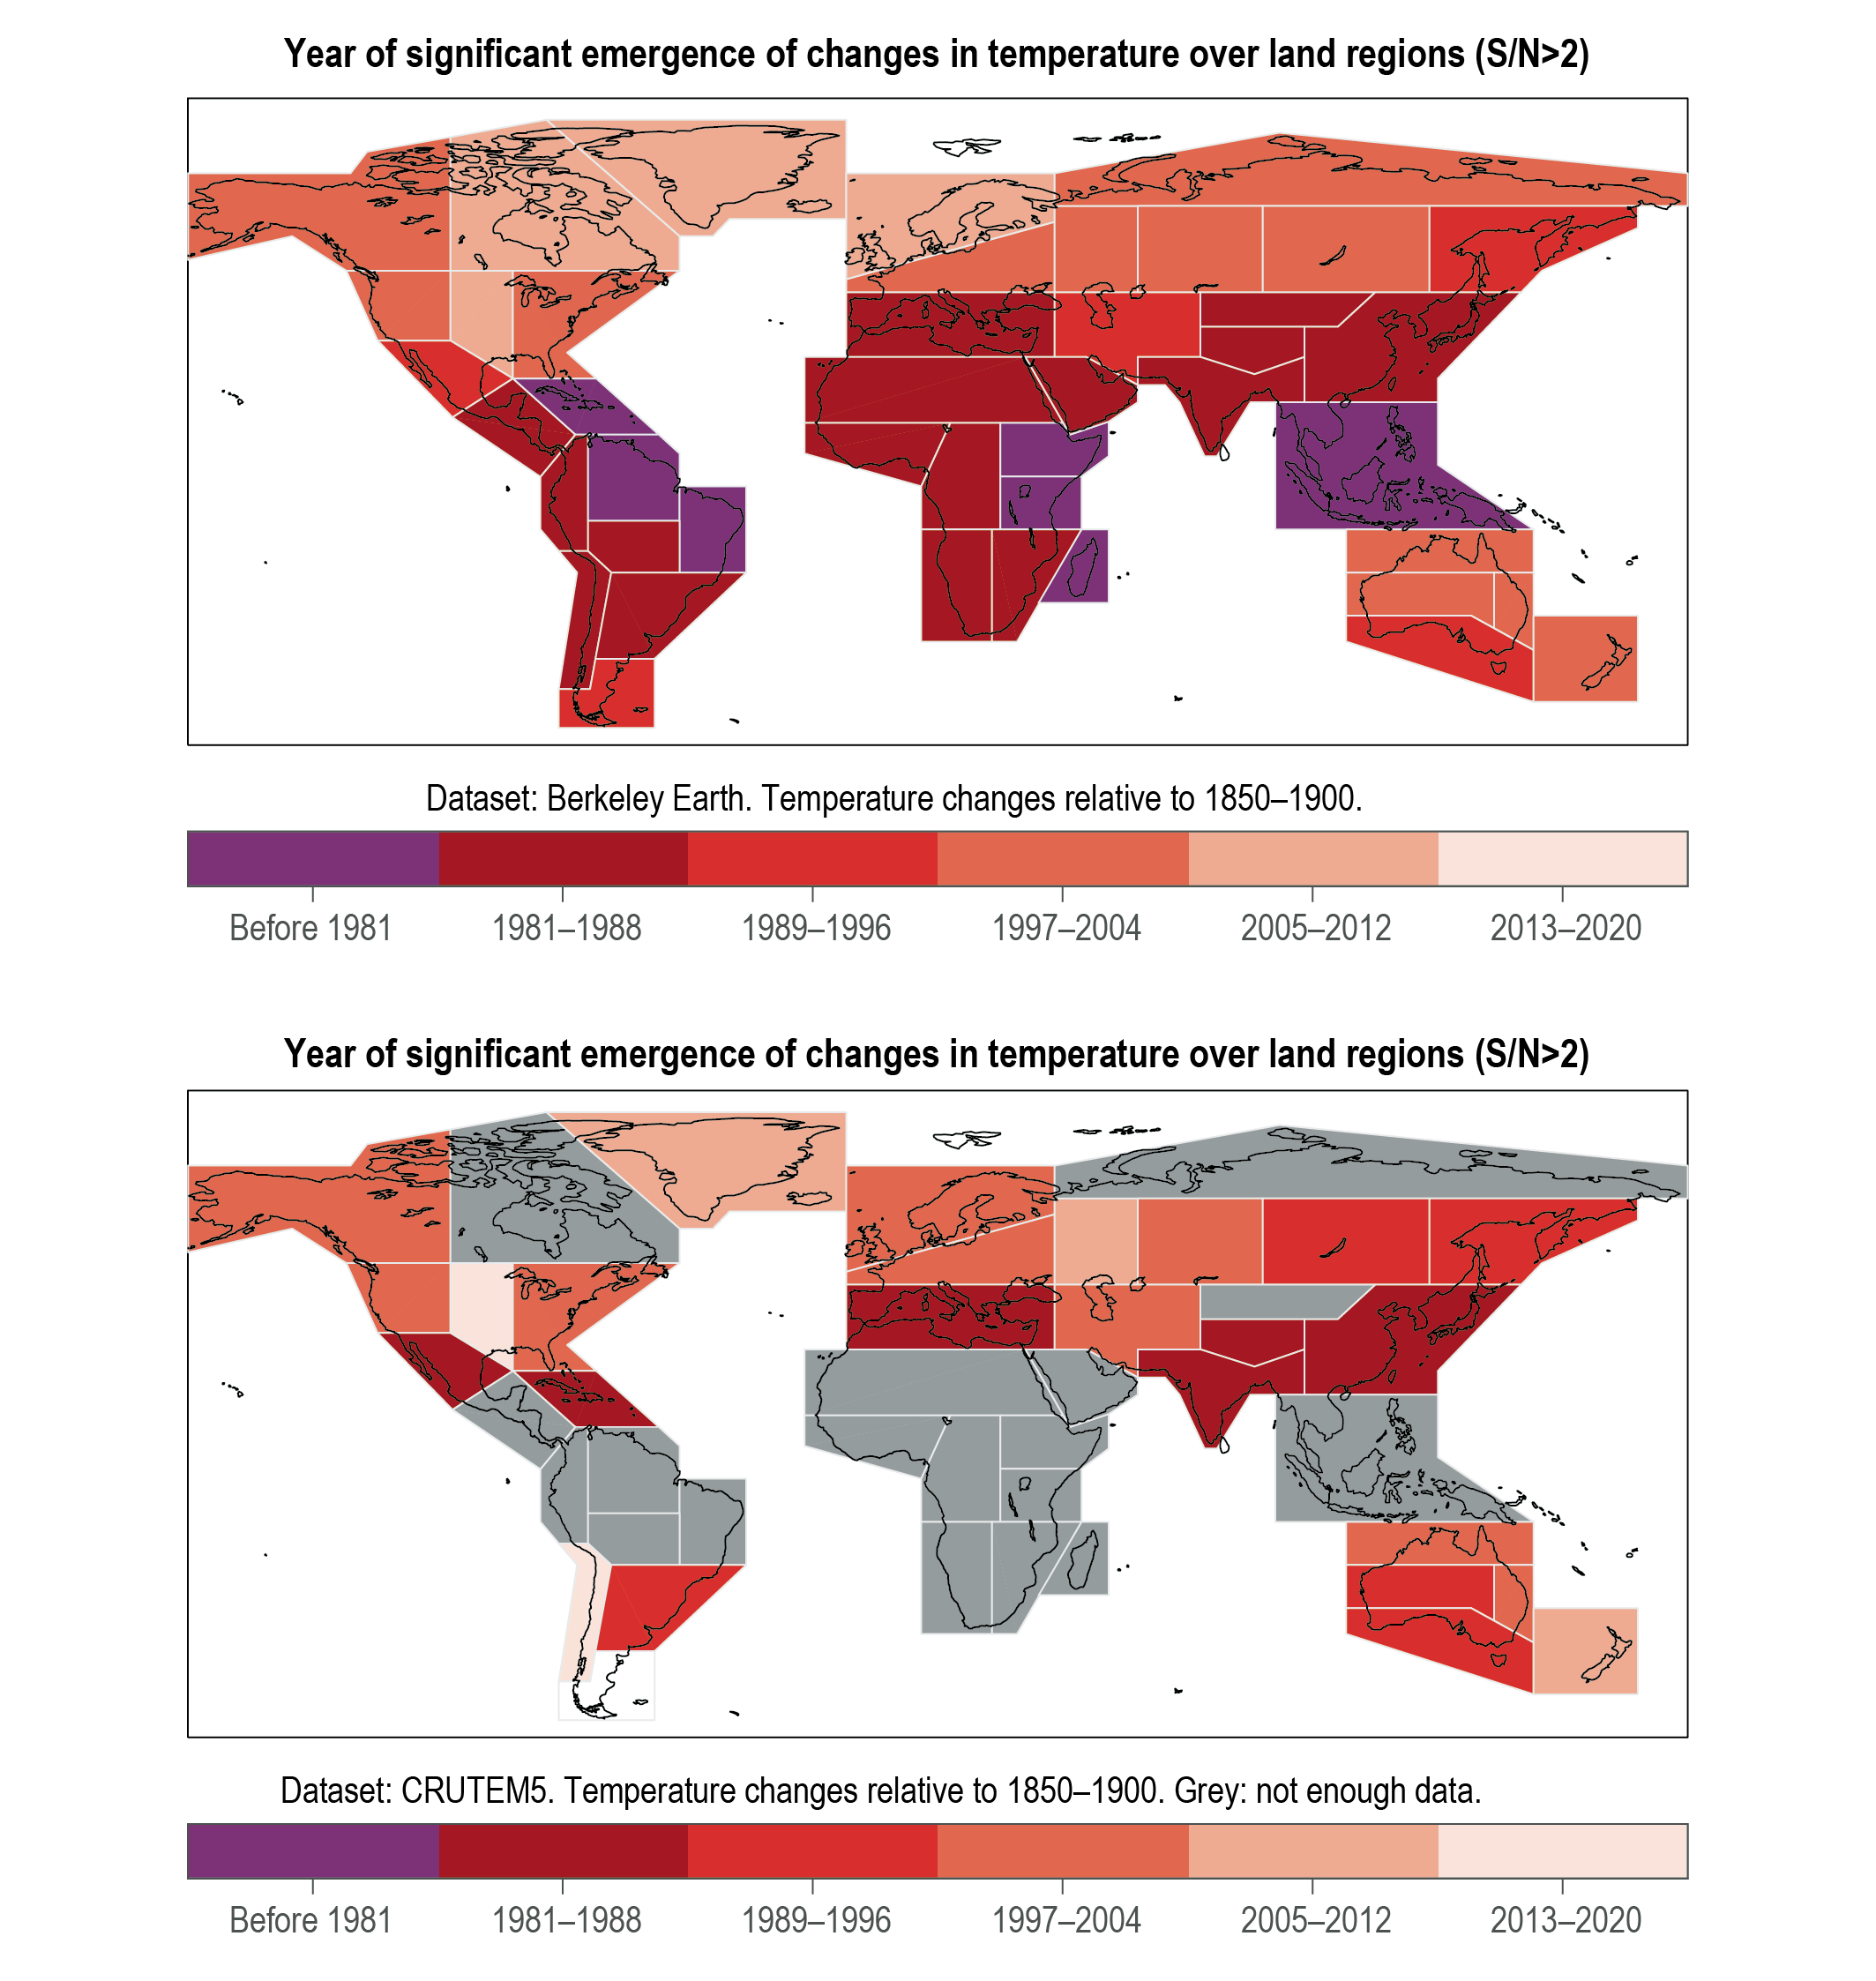
Figure caption
Figure TS.23 | Time period during which the signals of temperature change in observed data aggregated over the reference regions emerged from the noise of annual variability in the respective aggregated data, using a signal-to-noise ratio of two as the threshold for emergence. The intent of this figure is to show, for the AR6 WGI reference regions, when a signal of annual mean surface temperature change emerged from the noise of annual variability in two global datasets and thus also provide some information on observational uncertainty. Emergence time is calculated for two global observational datasets: (a) Berkeley Earth and (b) CRUTEM5. Regions in the CRUTEM5 map are shaded grey when data are available over less than 50% of the area of the region. (Section TS.1.2.4) {Figure Atlas.11}