Back chapter figures
Figure TS.25
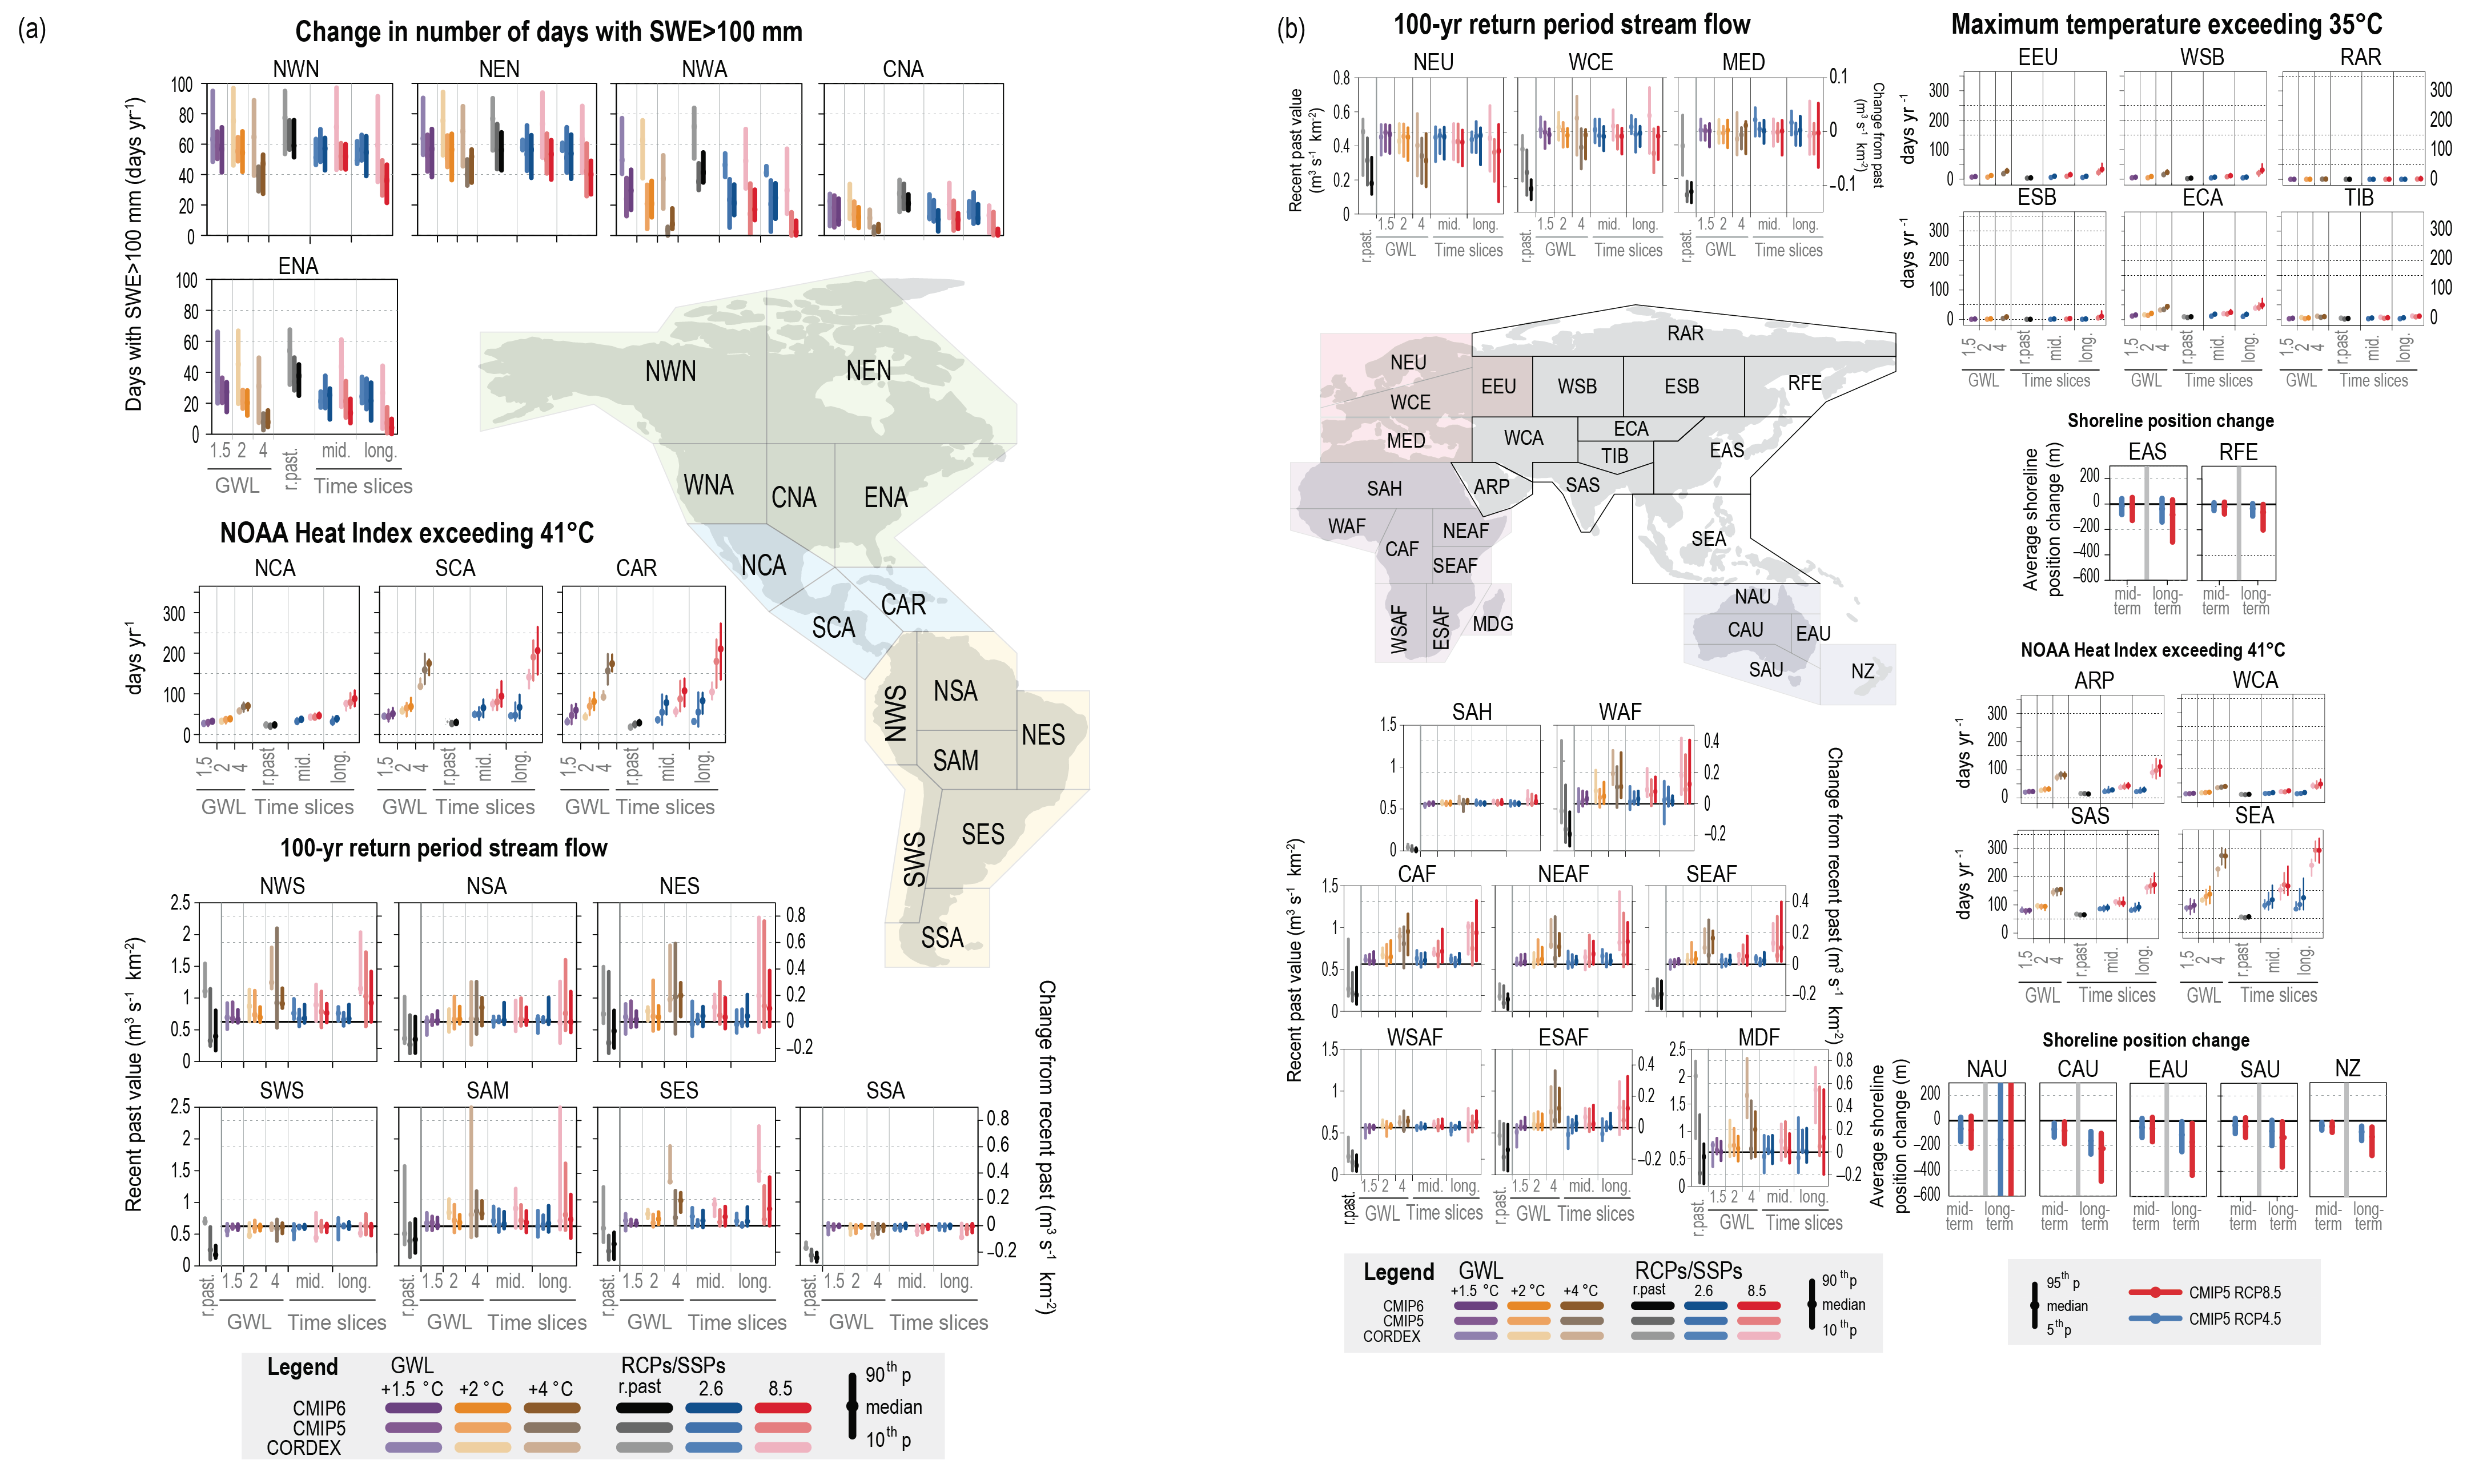
Figure caption
Figure TS.25 | Distribution of projected changes in selected climatic impact-driver (CID) indices for selected regions for Coupled Model Intercomparison Project Phases 5 and 6 (CMIP6, CMIP5) and Coordinated Regional Downscaling Experiment (CORDEX) model ensembles. The intent of this figure is to show that many CID projections for multiple global warming levels and scenarios time slices are available for all the AR6 WGI reference regions and are based on both global (CMIP5, CMIP6) and regional (CORDEX) model ensembles. Different indices are shown for different region: for Eastern Europe and North Asia, the mean number of days per year with maximum temperature exceeding 35°C; for Central America, the Caribbean, South West Asia, South Asia and South East Asia, the mean number of days per year with the National Oceanic and Atmospheric Administration (NOAA) Heat Index exceeding 41°C; for Australasia, East Asia and Russian Far East, the average shoreline position change; for South America, Europe and Africa, the mean change in 1-in-100-year river discharge per unit catchment area (m3s–1km–2); and for North America, the median change in the number of days with snow water equivalent (SWE) over 100 mm. For each box plot, the changes or the climatological values are reported with respect to, or compared to, the recent past (1995–2014) period for 1.5°C, 2°C and 4°C global warming levels and for mid-century (2041–2060) or end-century (2081–2100) periods for the CMIP5 and CORDEX RCP8.5 and RCP2.6 and CMIP6 SSP5-8.5 and SSP1-2.6 scenarios ensembles. {Figures 12.5, 12.6, 12.9, 12.SM.1, 12.SM.2, and 12.SM.6}