Back chapter figures
Figure TS.3
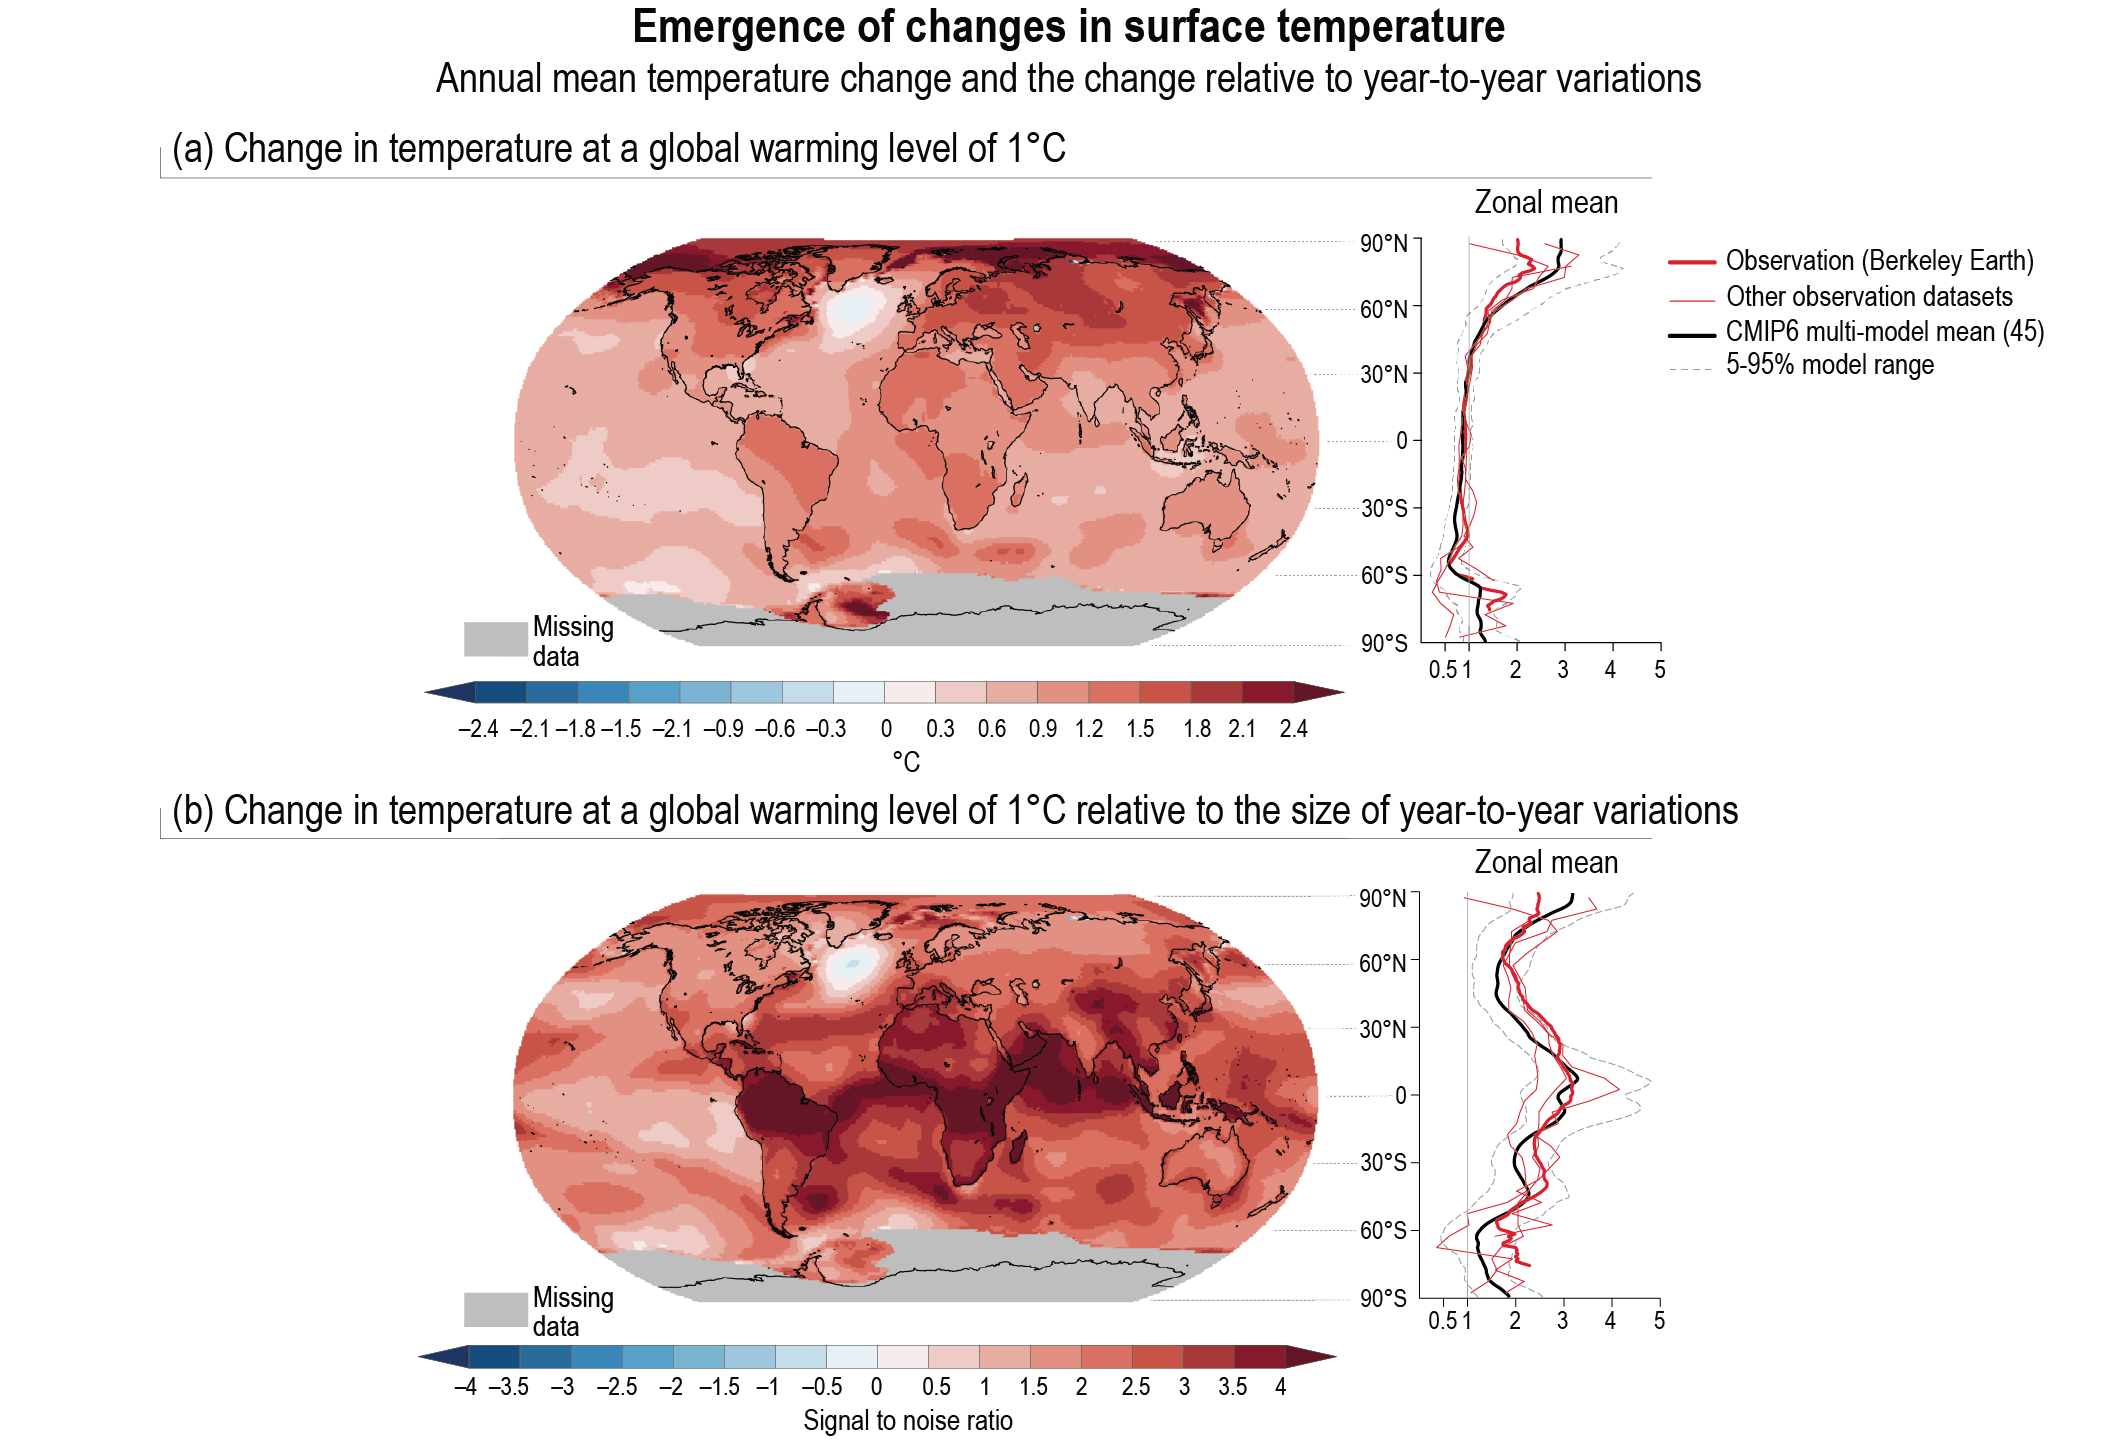
Figure caption
Figure TS.3 | Emergence of changes in temperature over the historical period. The intent of this figure is to show how observed changes in temperature have emerged and that the emergence pattern agrees with model simulations. The observed change in temperature at a global warming level of 1°C(a), and the signal-to-noise ratio (the change in temperature at a global warming level of 1°C, divided by the size of year-to-year variations, (b) ) using data from Berkeley Earth. The right panels show the zonal means of the maps and include data from different observational datasets (red) and the Coupled Model Intercomparison Project Phase 6 (CMIP6) simulations (black, including the 5–95% range) processed in the same way as the observations. {1.4.2, 10.4.3}