Back chapter figures
Figure TS.4
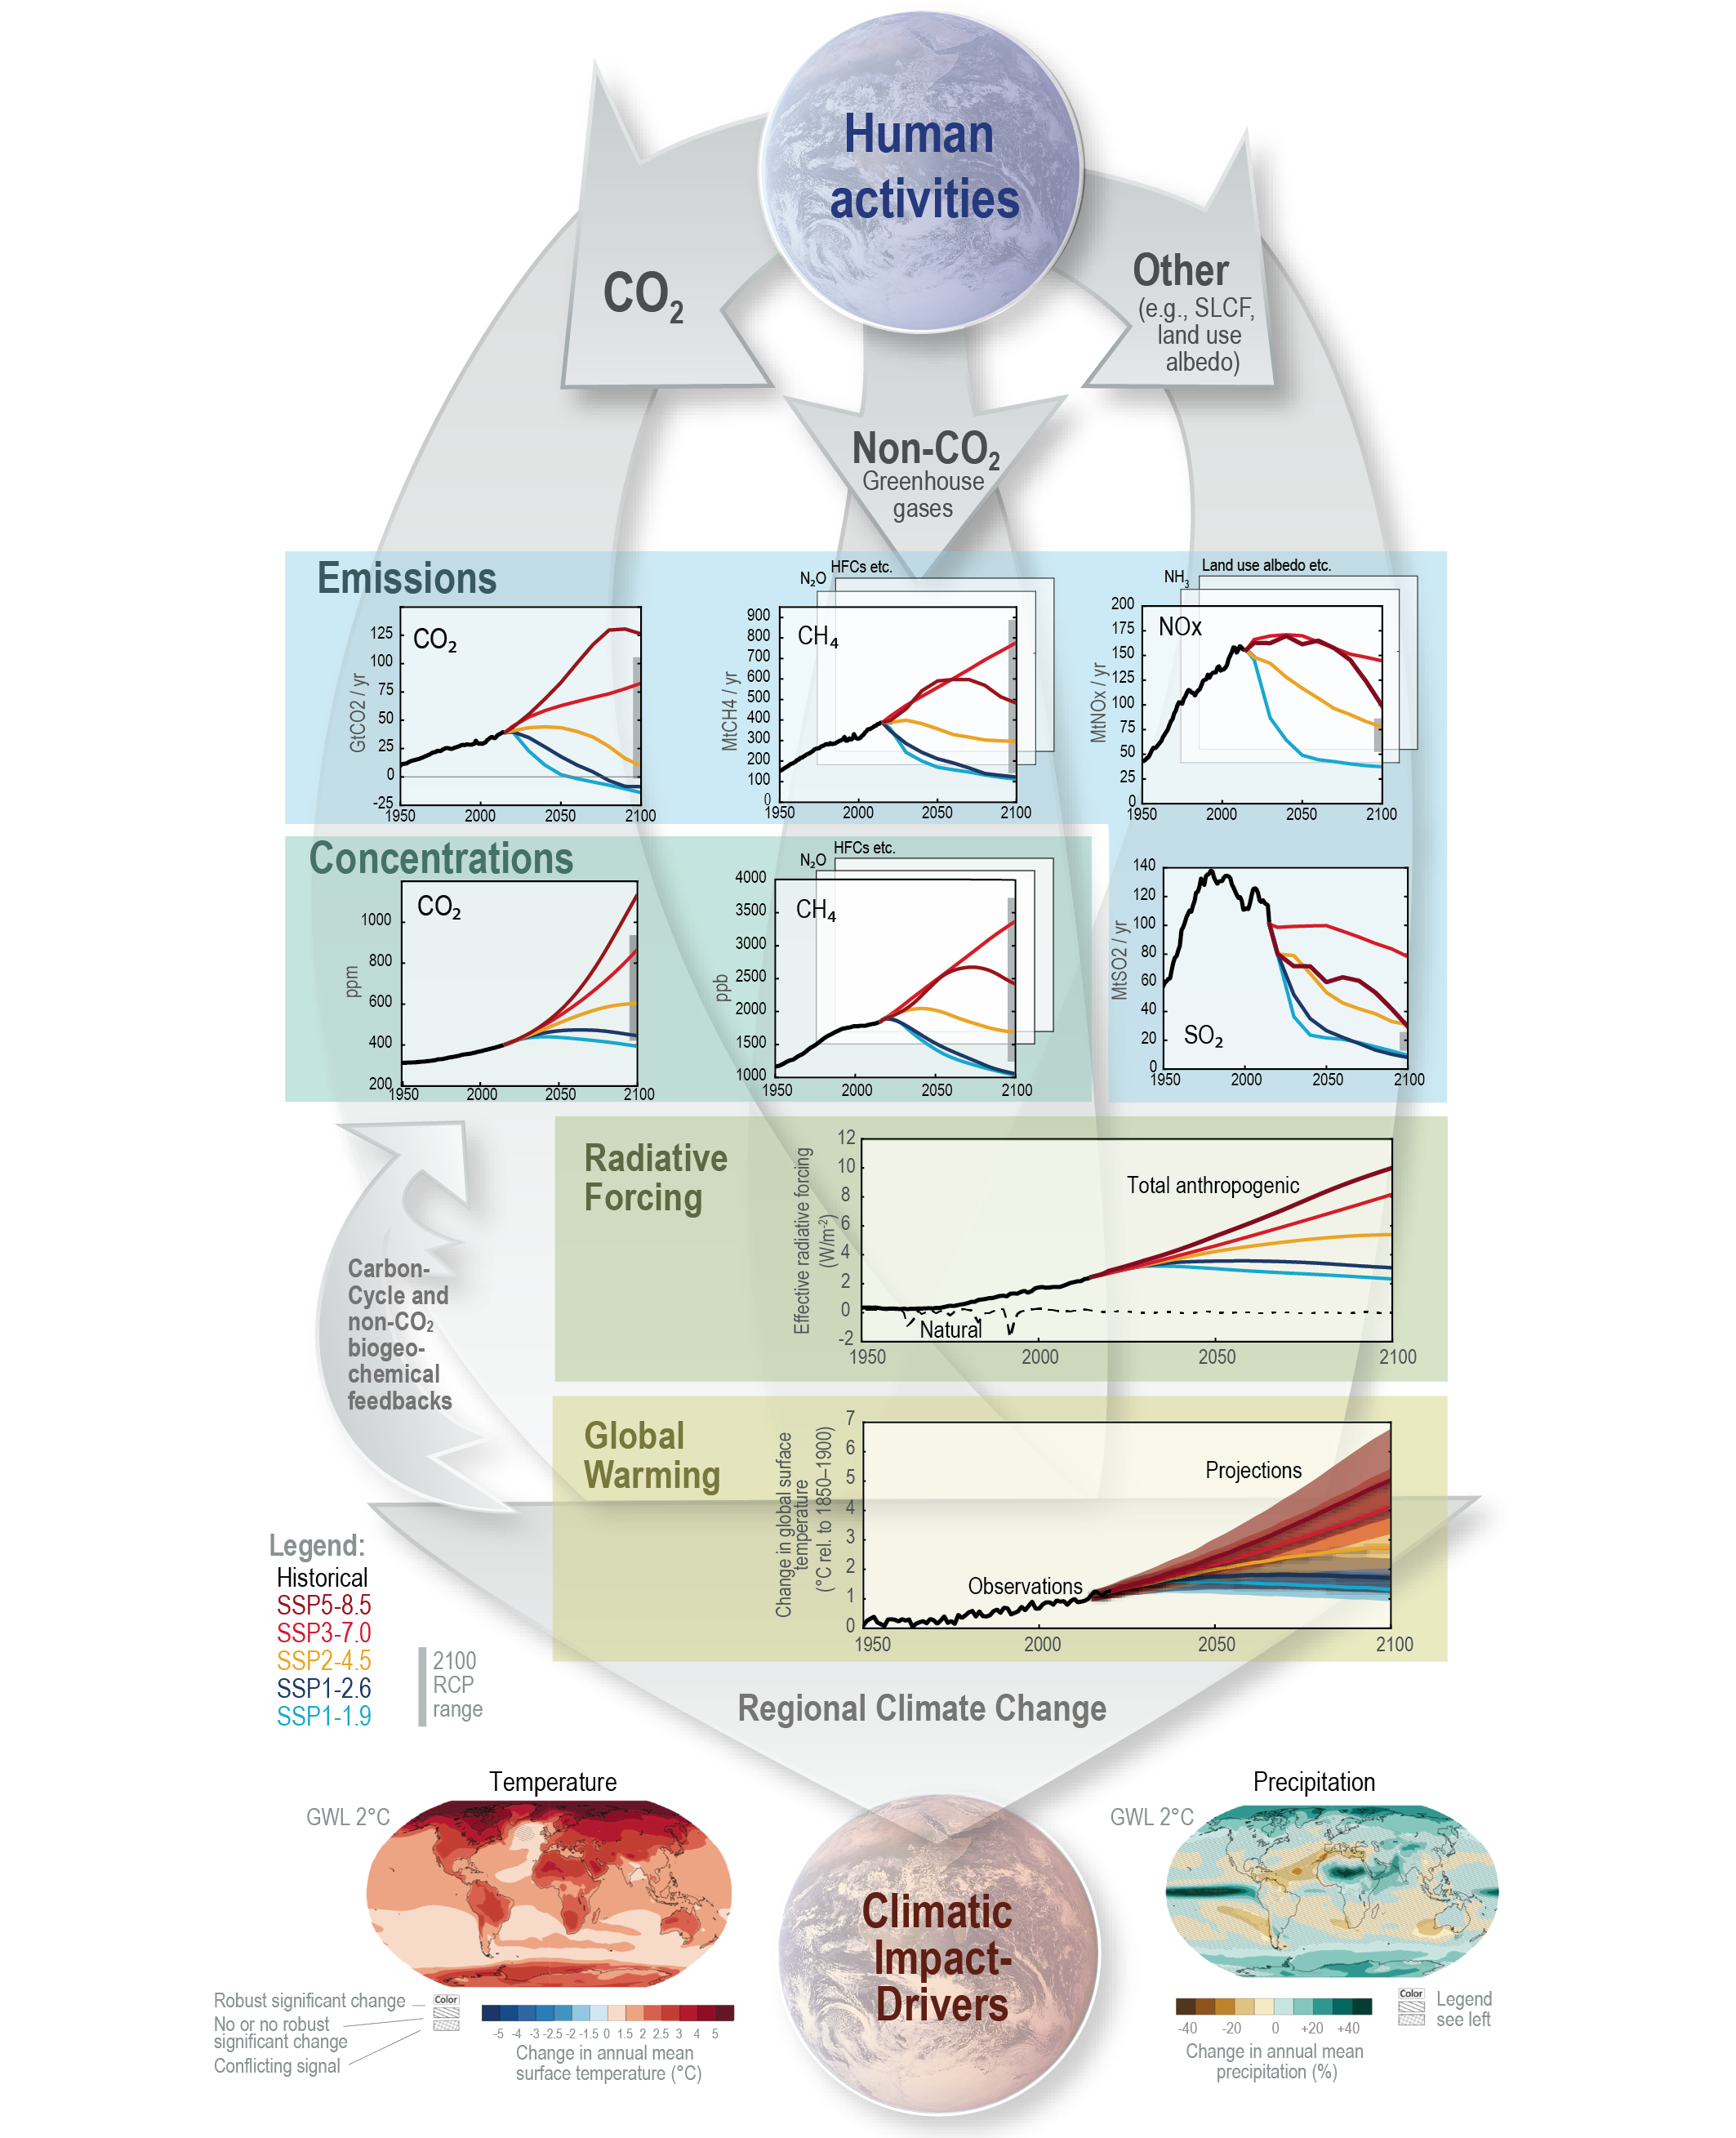
Figure caption
Figure TS.4 | The climate change cause–effect chain: The intent of this figure is to illustrate the process chain starting from anthropogenic emissions, to changes in atmospheric concentration, to changes in Earth’s energy balance (‘forcing’), to changes in global climate and ultimately regional climate and climatic impact-drivers. Shown is the core set of five Shared Socio-economic Pathway (SSP) scenarios as well as emissions and concentration ranges for the previous Representative Concentration Pathway (RCP) scenarios in year 2100; carbon dioxide (CO2) emissions (GtCO2yr–1), panel top left; methane (CH4) emissions (middle) and sulphur dioxide (SO2), nitrogen oxide (NOx) emissions (all in Mt yr–1), top right; concentrations of atmospheric CO2(ppm) and CH4 (ppb), second row left and right; effective radiative forcing for both anthropogenic and natural forcings (W m–2), third row; changes in global surface air temperature (°C) relative to 1850–1900, fourth row; maps of projected temperature change (°C) (left) and changes in annual-mean precipitation (%) (right) at a global warming level (GWL) of 2°C relative to 1850–1900 (see also Figure TS.5), bottom row. Carbon cycle and non-CO2 biogeochemical feedbacks will also influence the ultimate response to anthropogenic emissions (arrows on the left). {1.6.1, Cross-Chapter Box 1.4, 4.2.2, 4.3.1, 4.6.1, 4.6.2}