Back chapter figures
Figure TS.5
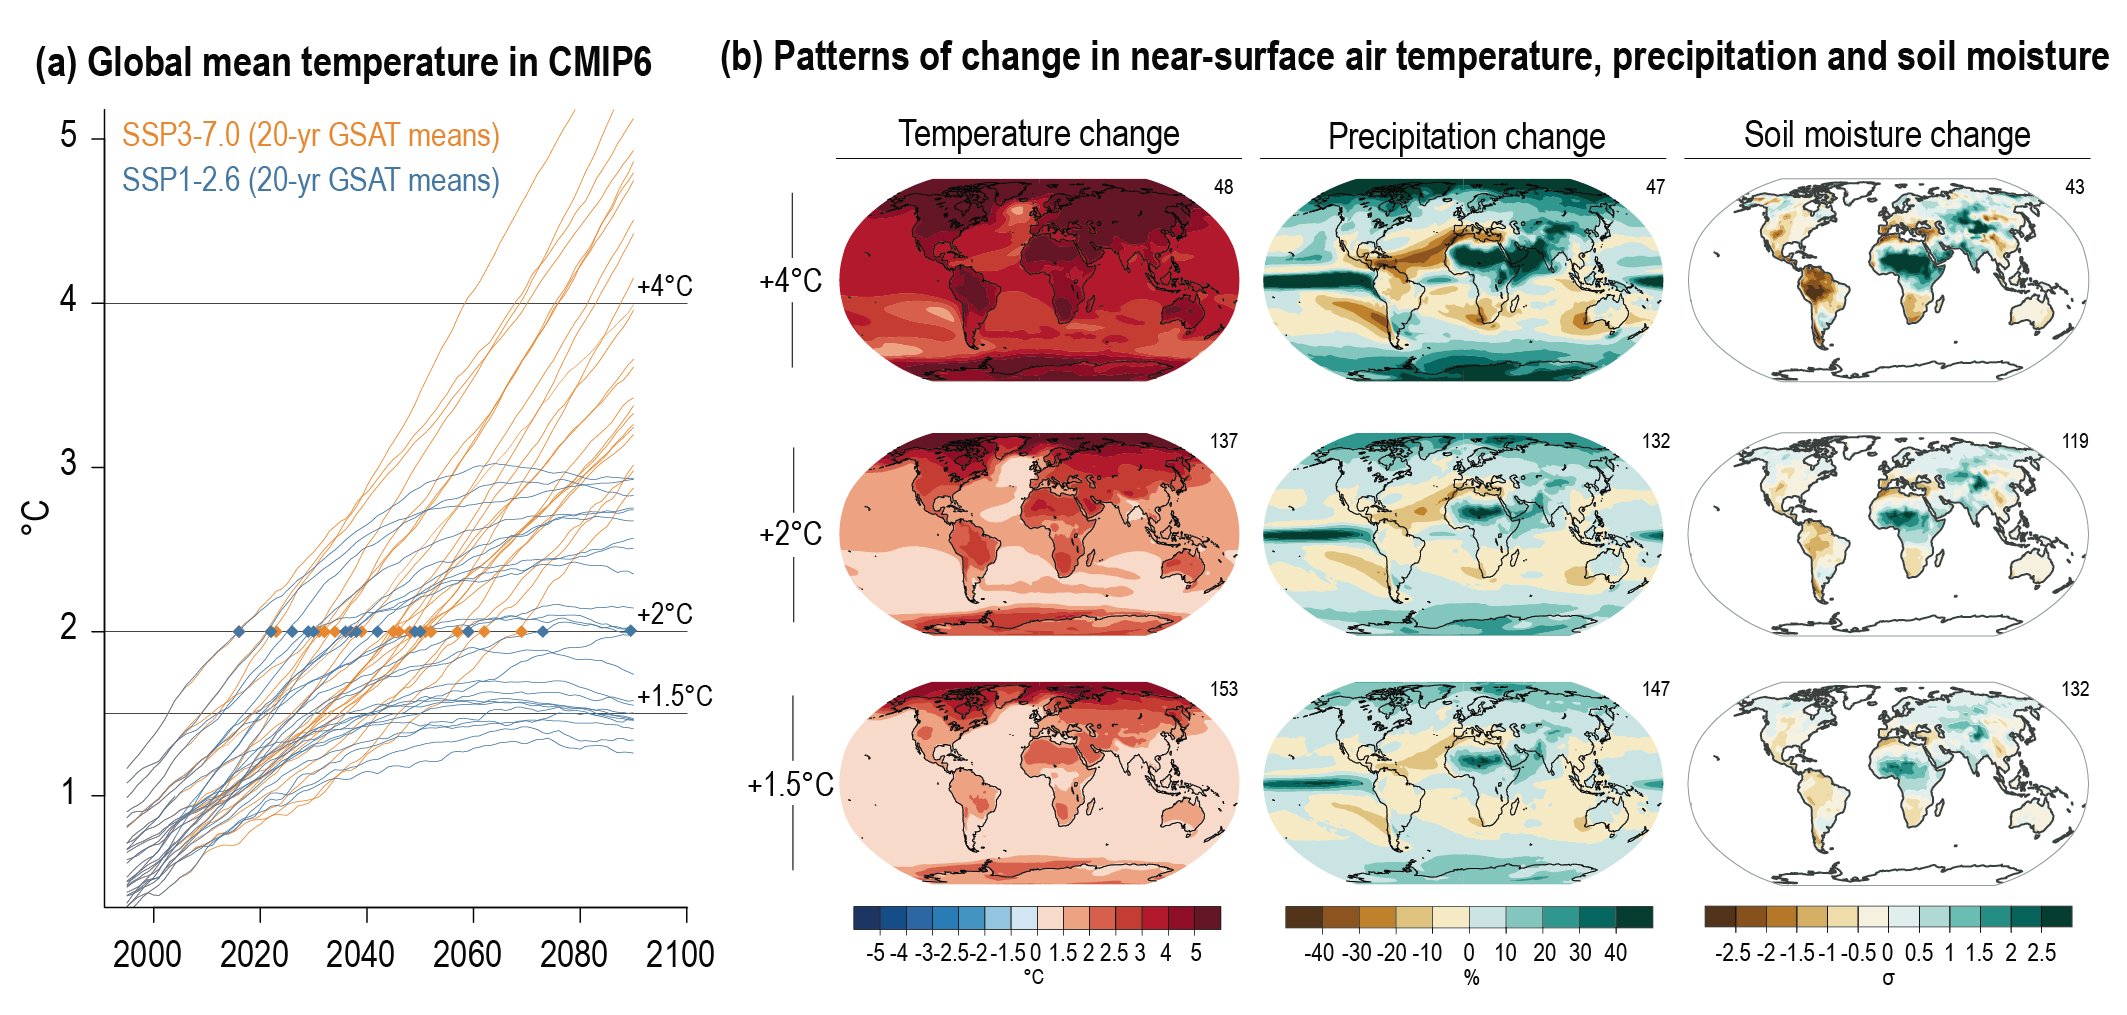
Figure caption
Figure TS.5 | Scenarios, global warming levels, and patterns of change. The intent of this figure is to show how scenarios are linked to global warming levels (GWLs) and to provide examples of the evolution of patterns of change with global warming levels. (a) Illustrative example of GWLs defined as global surface temperature response to anthropogenic emissions in unconstrained Coupled Model Intercomparison Project Phase 6 (CMIP6) simulations, for two illustrative scenarios (SSP1-2.6 and SSP3-7.0). The time when a given simulation reaches a GWL, for example, +2°C, relative to 1850–1900 is taken as the time when the central year of a 20-year running mean first reaches that level of warming. See the dots for +2°C, and how not all simulations reach all levels of warming. The assessment of the timing when a GWL is reached takes into account additional lines of evidence and is discussed in Cross-Section Box TS.1. (b) Multi-model, multi-simulation average response patterns of change in near-surface air temperature, precipitation (expressed as percentage change) and soil moisture (expressed in standard deviations of interannual variability) for three GWLs. The number to the top right of the panels shows the number of model simulations averaged across including all models that reach the corresponding GWL in any of the five Shared Socio-economic Pathways (SSPs). See Section TS.2 for discussion. {Cross-Chapter Box 11.1}