Back chapter figures
Figure TS.6
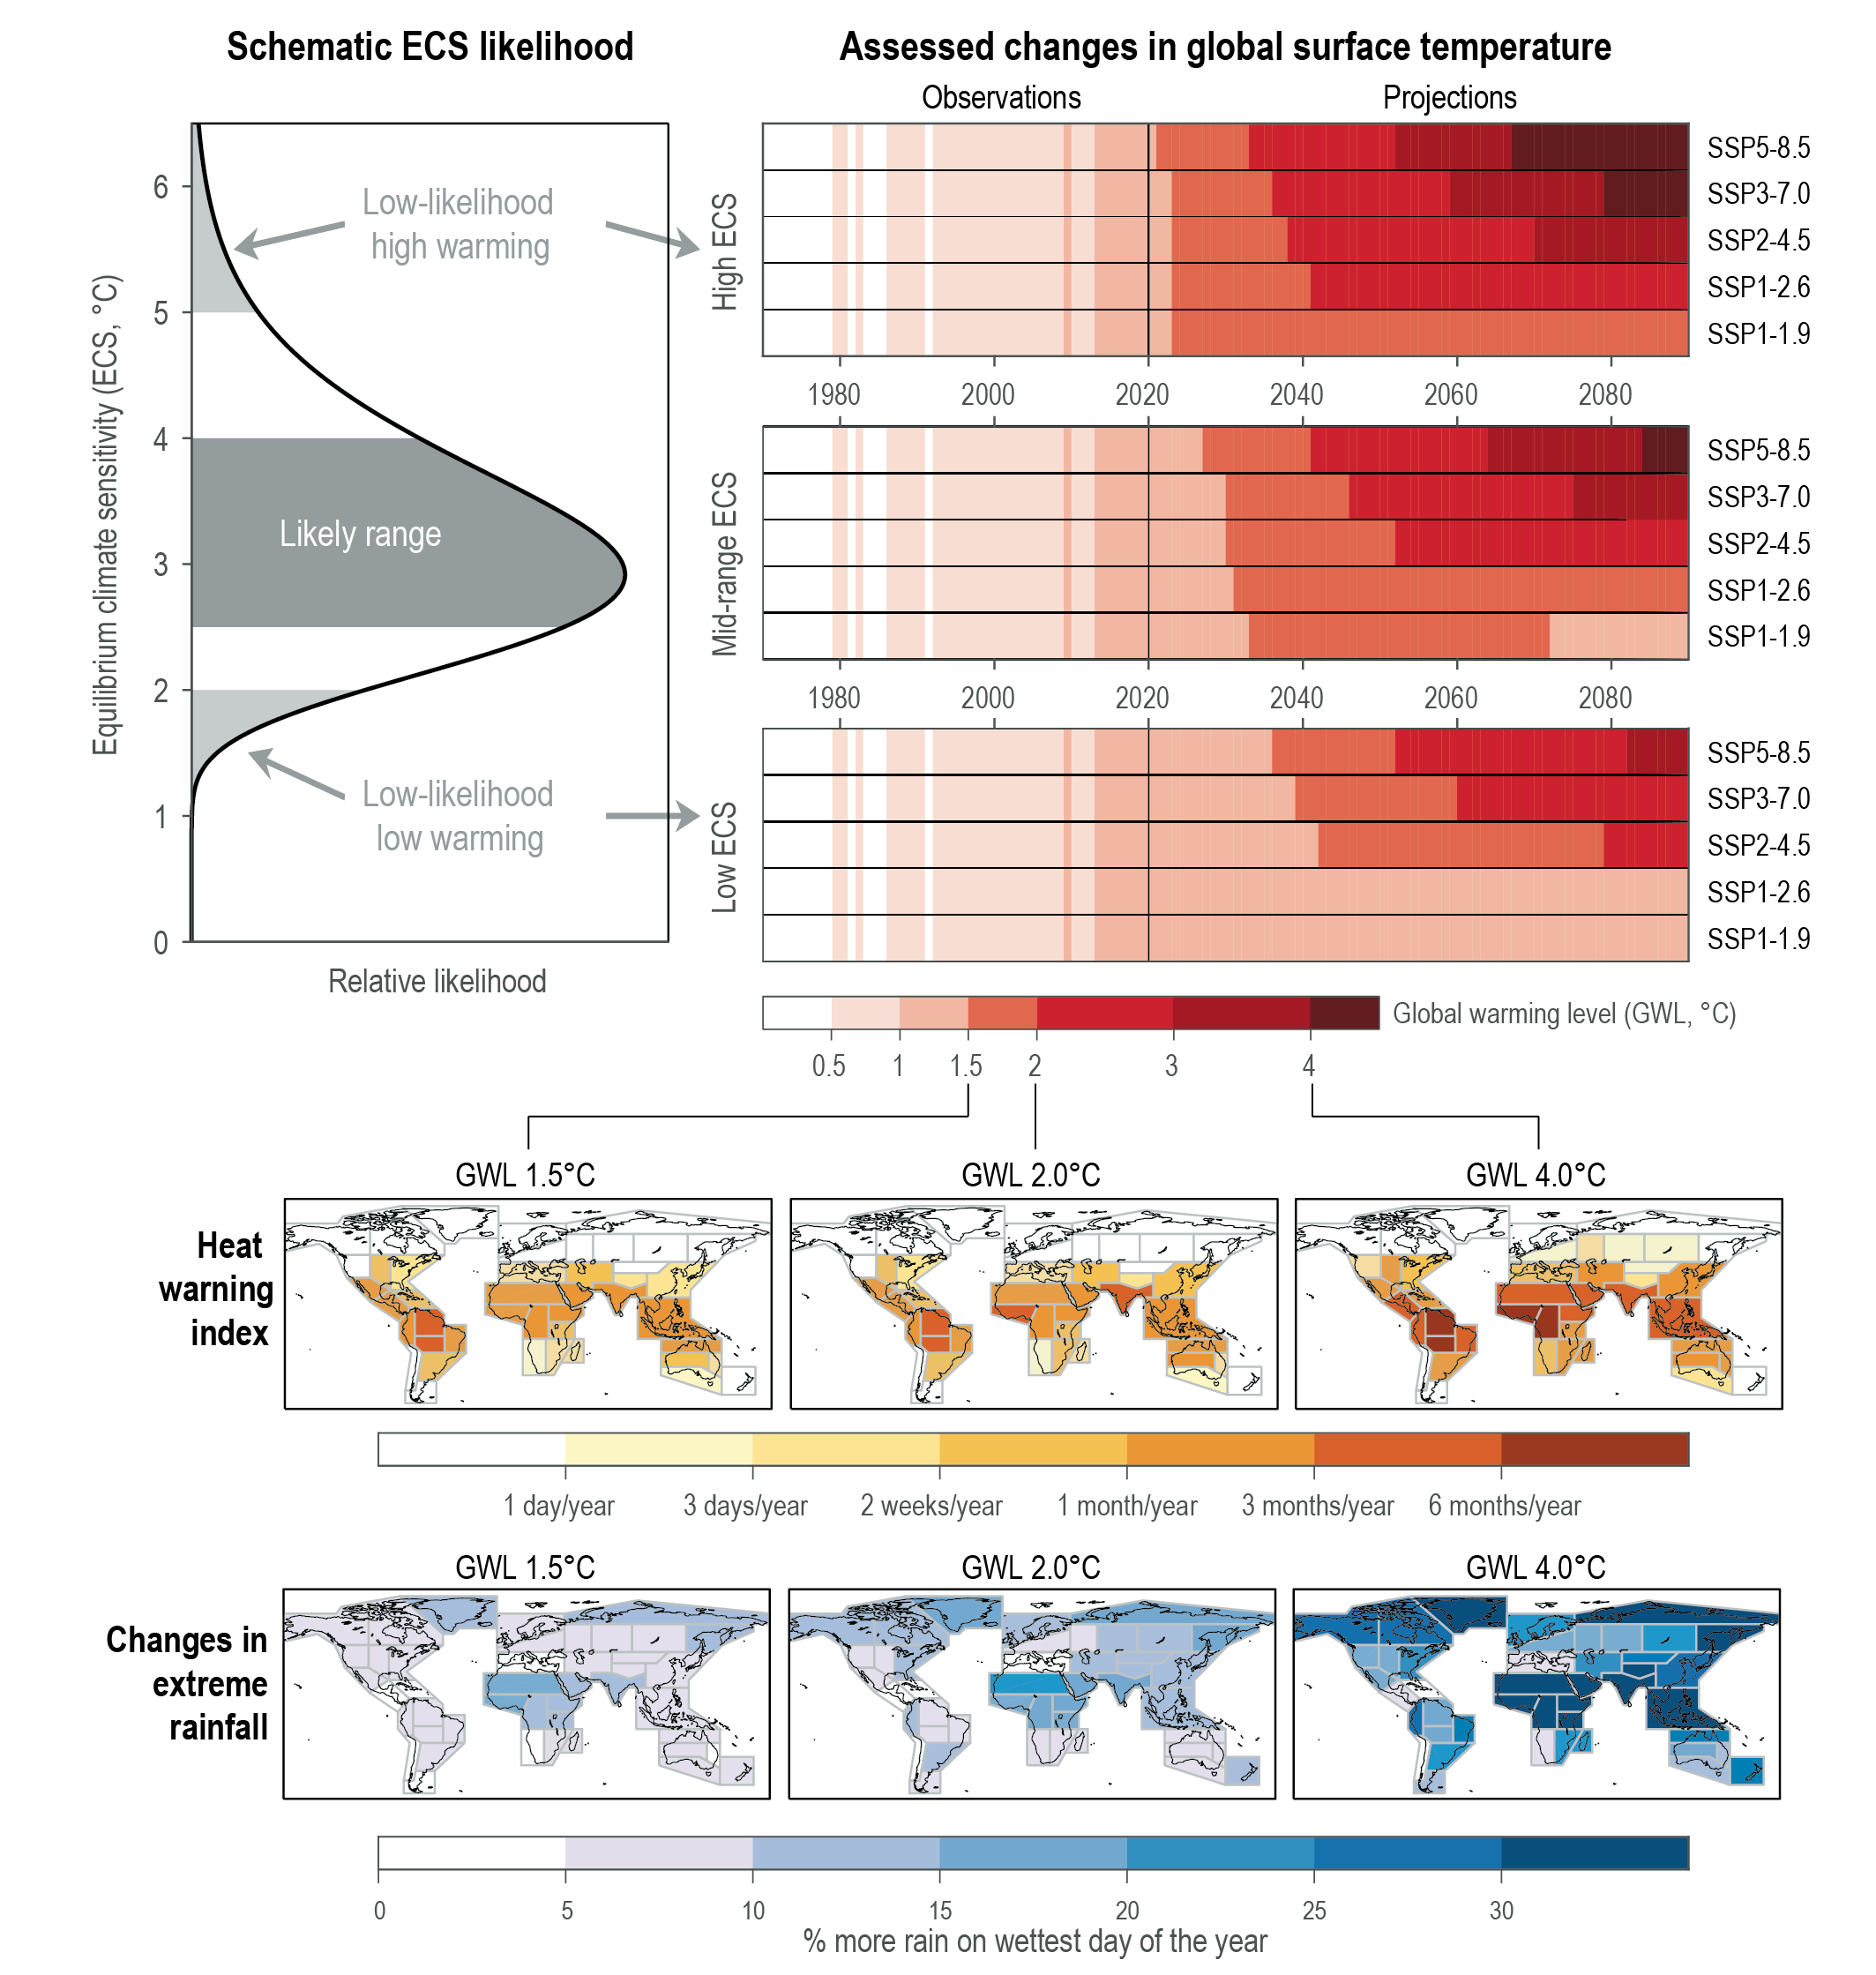
Figure caption
Figure TS.6 | A graphical abstract for key aspects of the Technical Summary. The intent of this figure is to summarize many different aspects of the Technical Summary related to observed and projected changes in global temperature and associated regional changes in climatic impact-drivers relevant for impact and risk assessment. Top left: a schematic representation of the likelihood for equilibrium climate sensitivity (ECS), consistent with the AR6 assessment (see Chapter 7 and Section TS.3). ECS values above 5°C and below 2°C are termed low-likelihood, high warming (LLHW) and low-likelihood, low warming, respectively (Box TS.3). Top right: Observed (see Cross-Section Box TS.1) and projected global surface temperature changes, shown as global warming levels (GWLs) relative to 1850–1900, using the assessed 95% (top), 50% (middle) and 5% (bottom) likelihood time series (see Chapter 4 and Section TS.2). Bottom panelsshow maps of Coupled Model Intercomparison Project Phase 6 (CMIP6) median projections of two climatic impact-drivers (CIDs, see Section TS.1.4) at three different GWLs (columns for 1.5, 2 and 4°C) for the AR6 land regions (see Chapters 1, 10, and Atlas and Section TS.4). The heat warning index is the number of days per year averaged across each region at which a heat warning for human health at level ‘danger’ would be issued according to the U.S. National Oceanic and Atmospheric Administration (NOAA) (NOAA HI41, see Chapter 12 and Annex VI). The maps of extreme rainfall changes show the percentage change in the amount of rain falling on the wettest day of a year (Rx1day, relative to 1995–2014, see Chapter 11) averaged across each region when the respective GWL is reached. Additional CIDs are discussed in Section TS.4. {1.4.4, Box 4.1, 7.5, 11.4.3, 12.4}