Back chapter figures
Figure TS.8
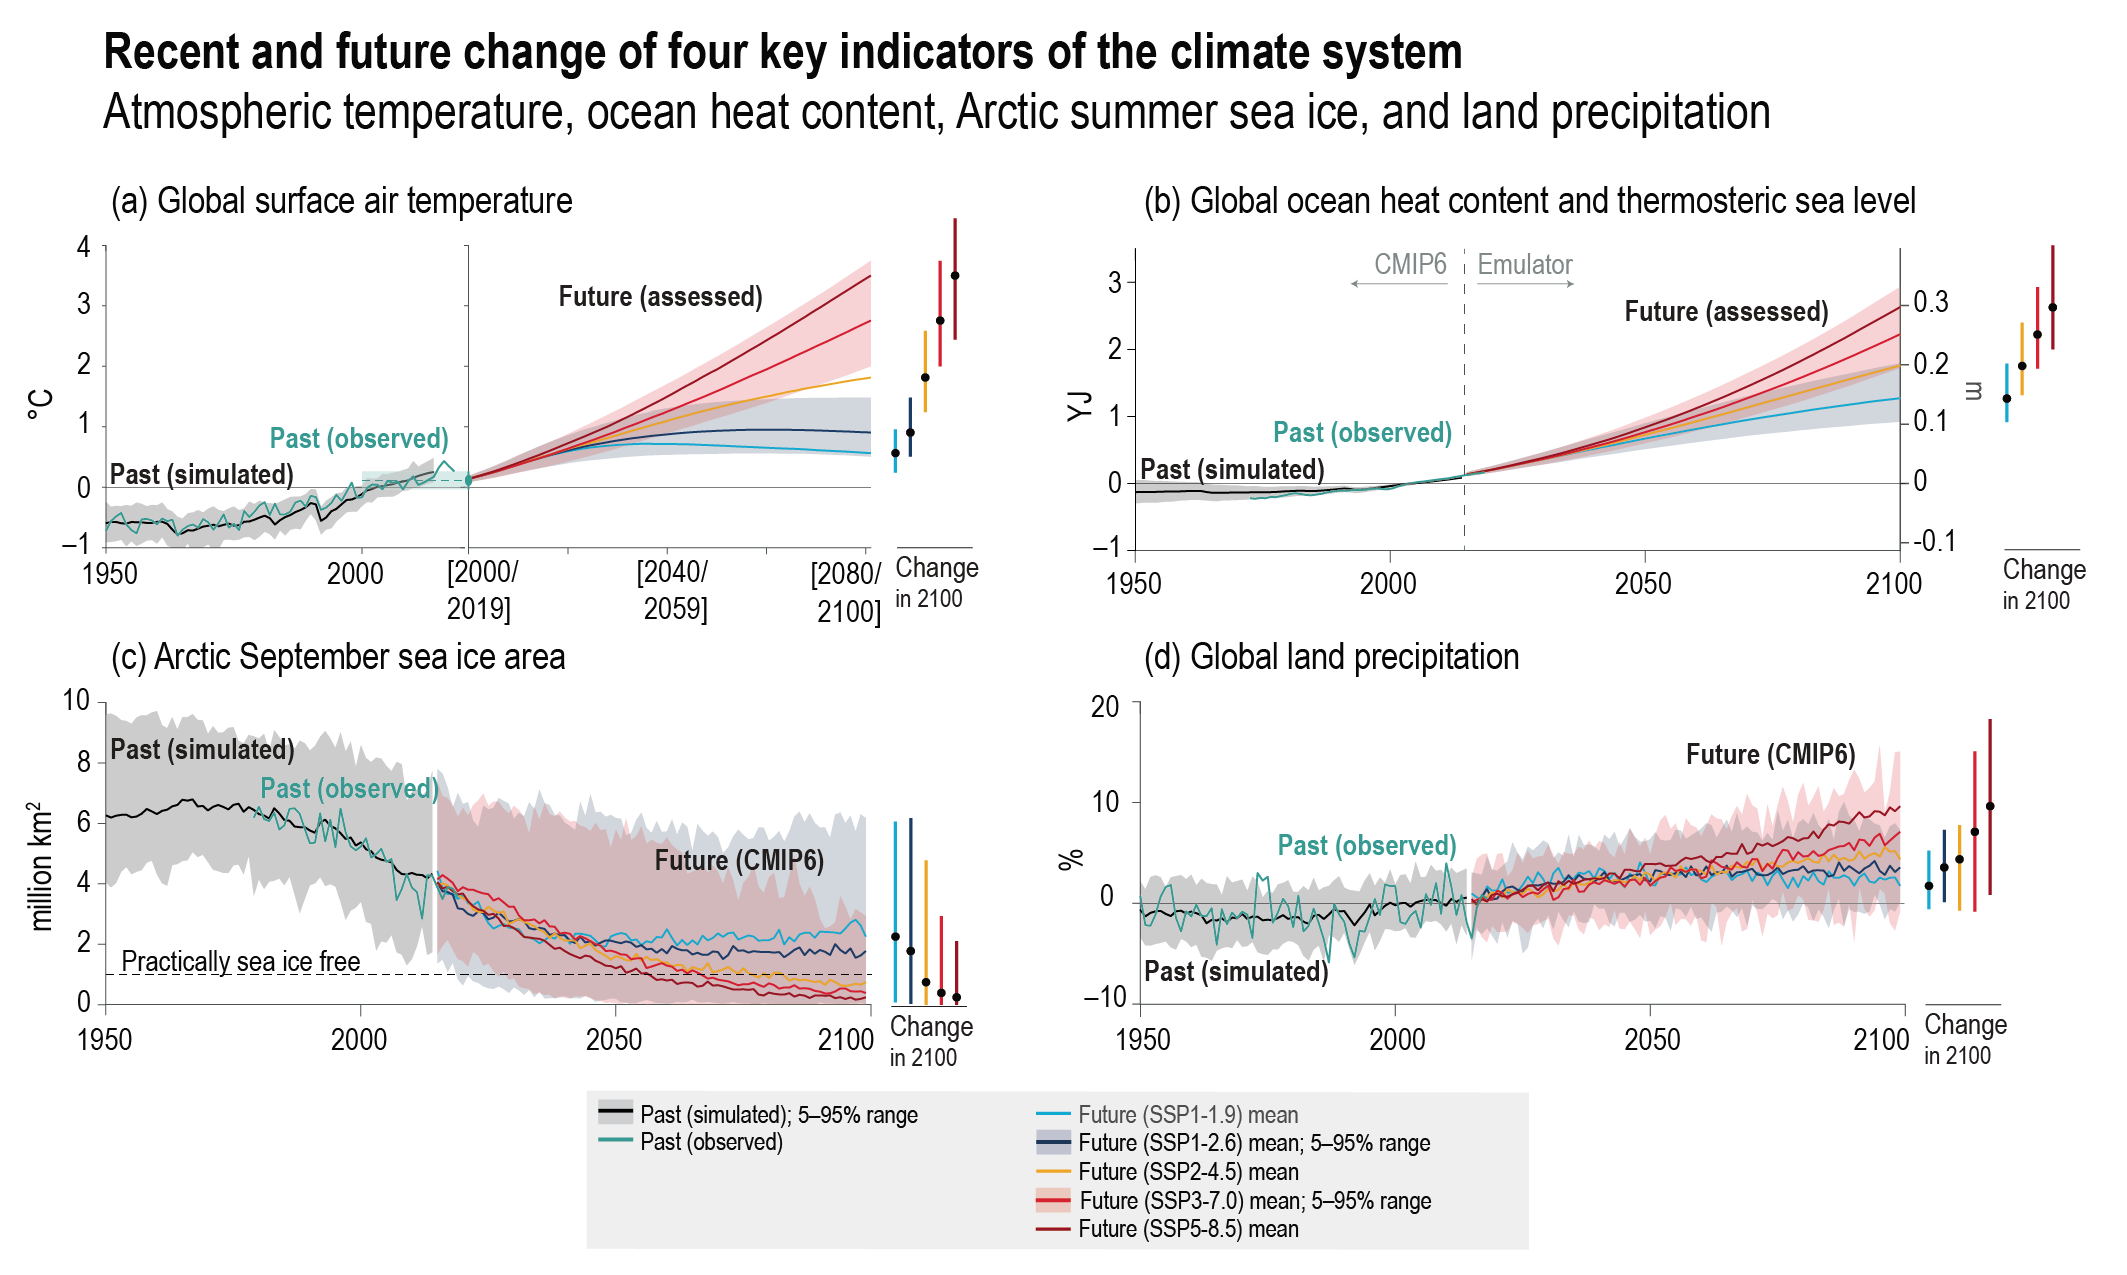
Figure caption
Figure TS.8 | Observed, simulated and projected changes compared to the 1995–2014 average in four key indicators of the climate system through to 2100 differentiated by Shared Socio-economic Pathway (SSP) scenario. The intent of this figure is to show how future emissions choices impact key, iconic large-scale indicators and to highlight that our collective choices matter. Past simulations are based on the Coupled Model Intercomparison Project Phase 6 (CMIP6) multi-model ensemble. Future projections are based on the assessed ranges based upon multiple lines of evidence for (a) global surface temperature (Cross-Section Box TS.1) and (b) global ocean heat content and the associated thermosteric sea level contribution to global mean sea level change (right-hand axis) using a climate model emulator (Cross-Chapter Box 7.1), and CMIP6 simulations for (c) Arctic September sea ice and (d) global land precipitation. Projections for SSP1-1.9 and SSP1-2.6 show that reduced greenhouse gas emissions lead to a stabilization of global surface temperature, Arctic sea ice area and global land precipitation over the 21st century. Projections for SSP1-2.6 show that emissions reductions have the potential to substantially reduce the increase in ocean heat content and thermosteric sea level rise over the 21st century but that some increase is unavoidable. The brackets in the x axis in panel (a) indicate assessed 20-year-mean periods. {4.3, Figure 4.2, 9.3, 9.6, Figure 9.6}