Back chapter figures
Cross-Section Box TS.1, Figure 1
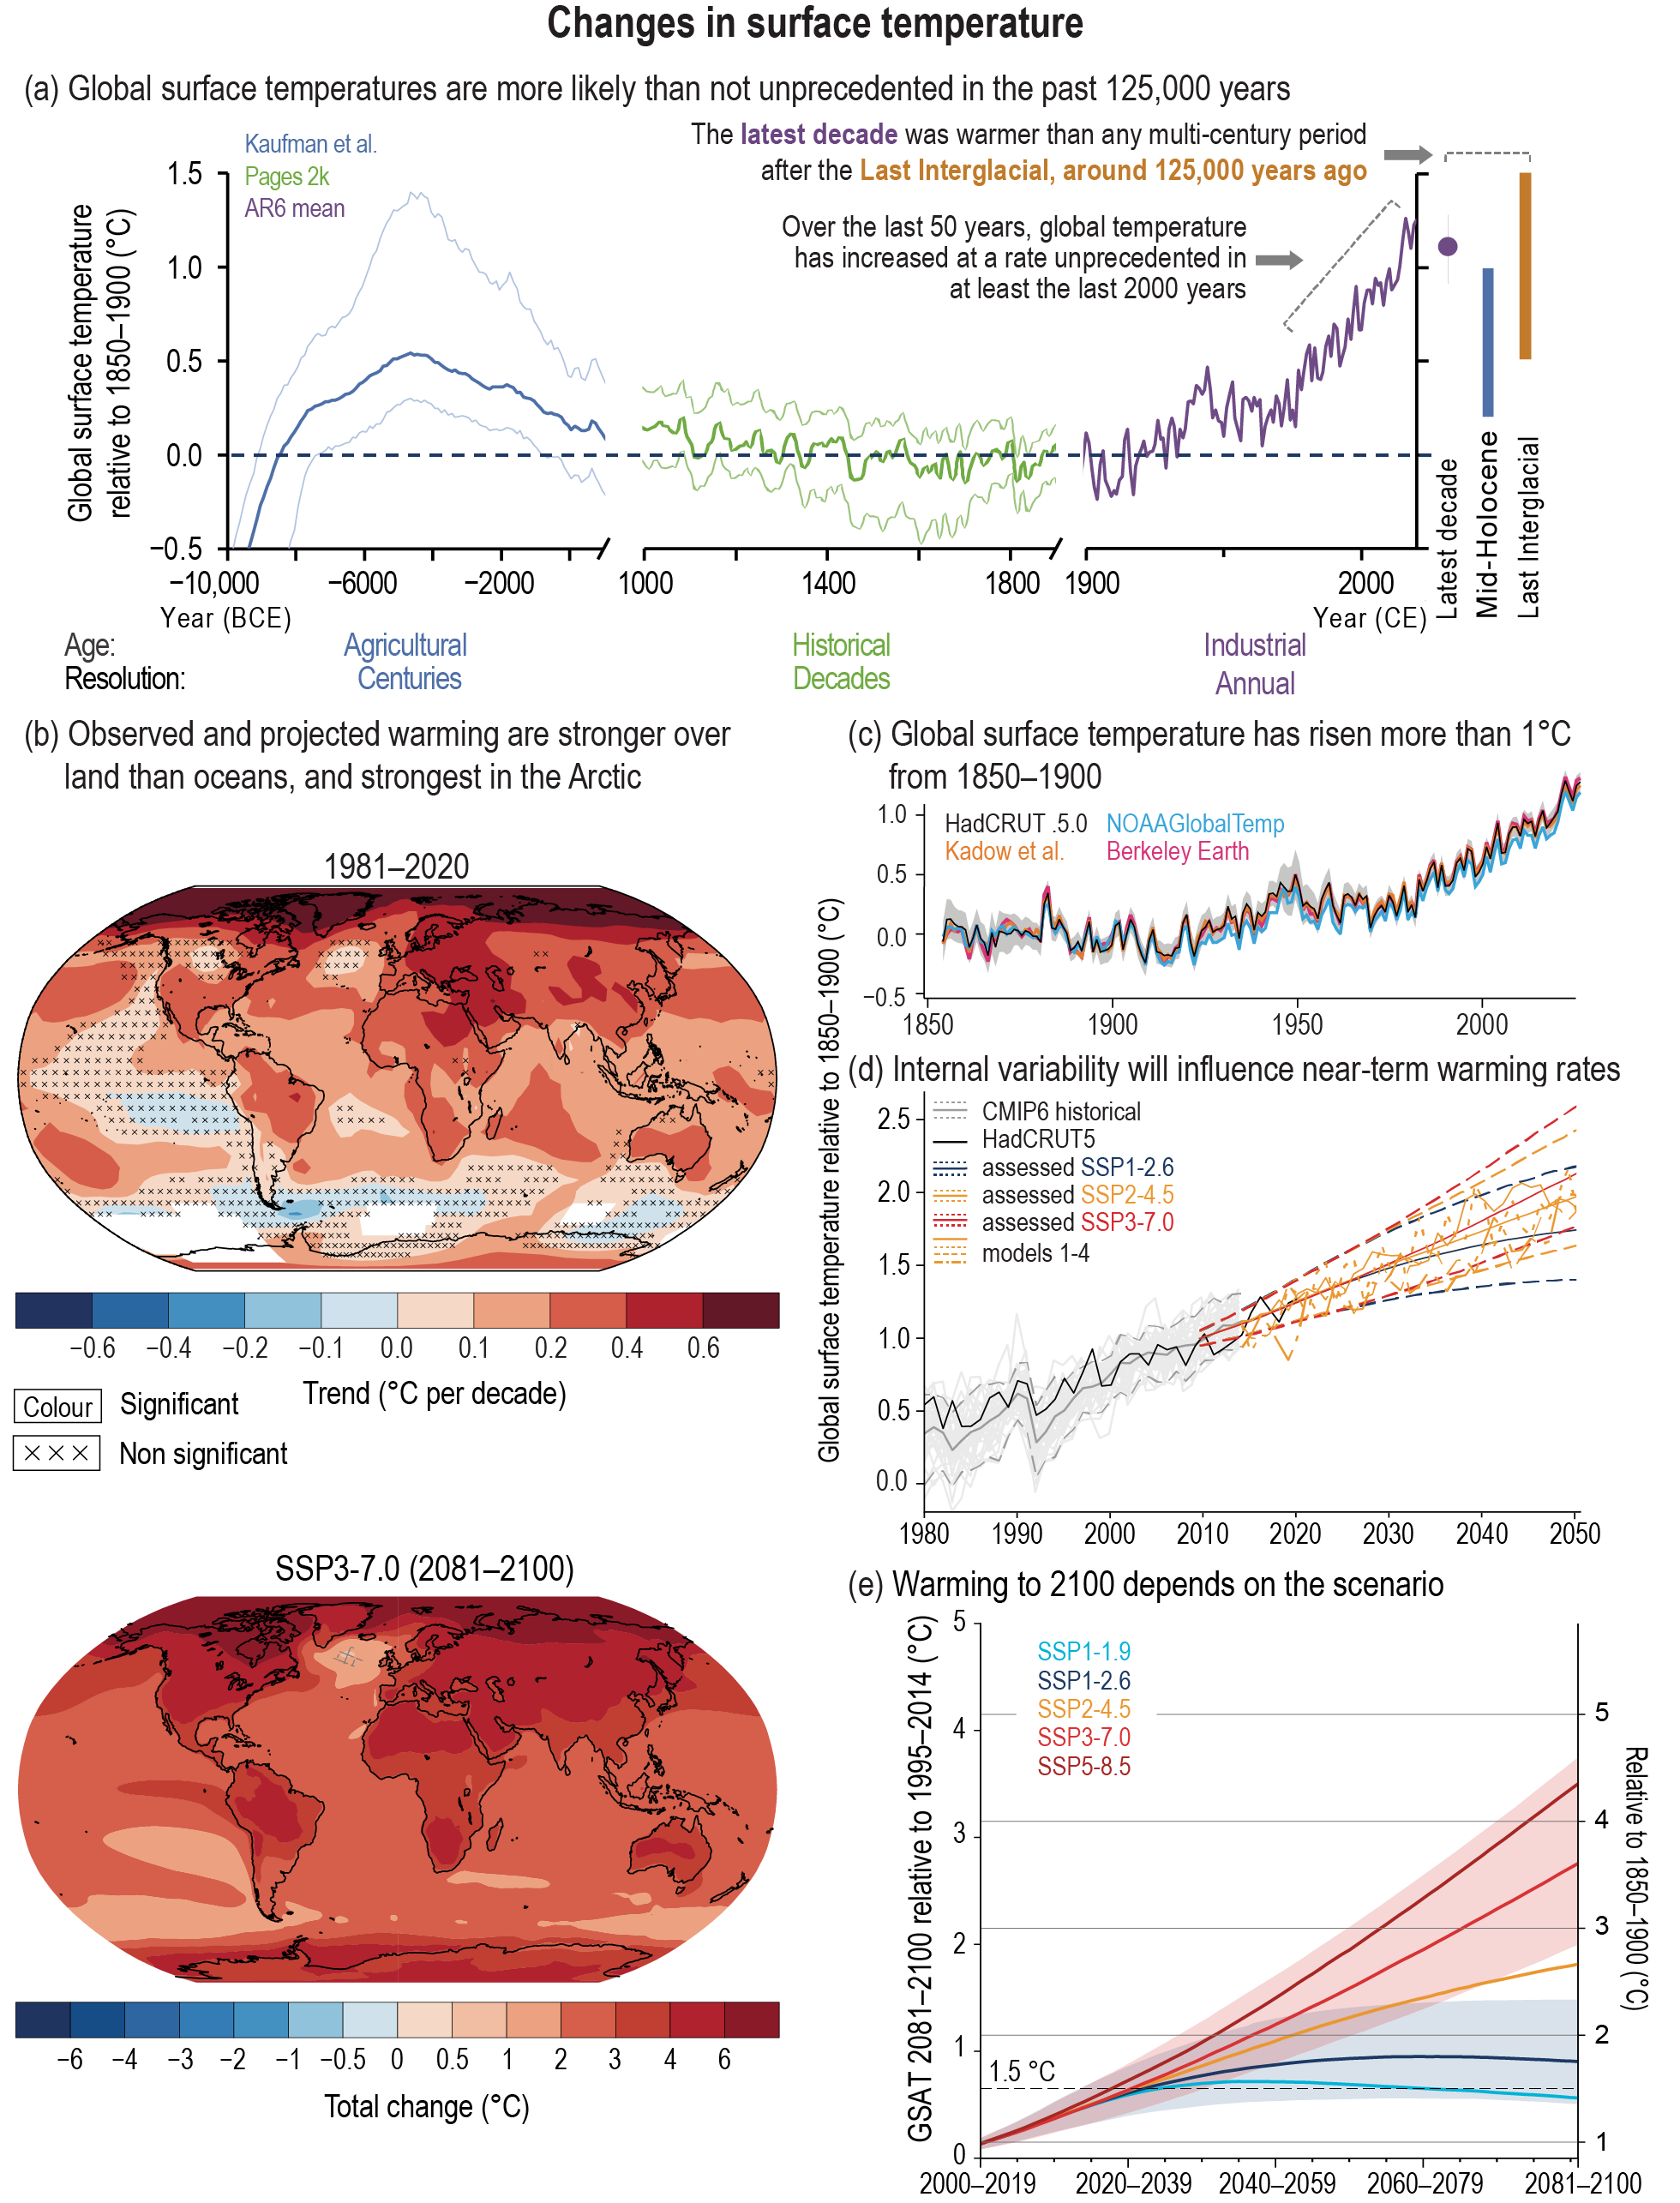
Figure caption
Cross-Section Box TS.1, Figure 1 | Earth’s surface temperature history and future with key findings annotated within each panel. The intent of this figure is to show global surface temperature observed changes from the Holocene to now, and projected changes. (a) Global surface temperature over the Holocene divided into three time scales: (i) 12,000 to 1000 years ago (10,000 BCE to 1000 CE) in 100-year time steps, (ii) 1000 to 1900 CE, 10-year smooth, and (iii) 1900 to 2020 CE (mean of four datasets in panel c). Bold lines show the median of the multi-method reconstruction, with 5% and 95% percentiles of the ensemble members (thin lines). Vertical bars are 5–95th percentile ranges of estimated global surface temperature for the Last Interglacial and mid-Holocene (medium confidence) (Section 2.3.1.1). All temperatures are relative to 1850–1900. (b) Spatially resolved trends (°C per decade) for (upper map) HadCRUTv5 over 1981–2020, and (lower map, total change) multi-model mean projected changes from 1995–2014 to 2081–2100 in the SST3-7.0 scenario. Observed trends have been calculated where data are present in both the first and last decade and for at least 70% of all years within the period using ordinary least squares. Significance is assessed with autoregressive AR(1) model correction and denoted by stippling. Hatched areas in the lower map show areas of conflicting model evidence on significance of changes. (c) Temperature from instrumental data for 1850–2020, including annually resolved averages for the four global surface temperature datasets assessed in Section 2.3.1.1.3 (see text for references). The grey shading shows the uncertainty associated with the HadCRUTv5 estimate. All temperatures are relative to the 1850–1900 reference period. (d) Recent past and 2015–2050 evolution of annual mean global surface temperature change relative to 1850–1900, from HadCRUTv5 (black), Coupled Model Intercomparison Project Phase 6 (CMIP6) historical simulations (up to 2014, in grey, ensemble mean solid, 5% and 95% percentiles dashed, individual models thin), and CMIP6 projections under scenario SSP2-4.5, from four models that have an equilibrium climate sensitivity near the assessed central value (thick yellow). Solid thin coloured lines show the assessed central estimate of 20-year change in global surface temperature for 2015–2050 under three scenarios, and dashed thin coloured lines the corresponding 5% and 95% quantiles. (e) Assessed projected change in 20-year running mean global surface temperature for five scenarios (central estimate solid, very likely range shaded for SSP1-2.6 and SSP3-7.0), relative to 1995–2014 (left y-axis) and 1850–1900 (right y-axis). The y-axis on the right-hand side is shifted upward by 0.85°C, the central estimate of the observed warming for 1995–2014, relative to 1850–1900. The right y-axis in (e) is the same as the y-axis in (d). {2.3, 4.3, 4.4}