Infographic TS.1
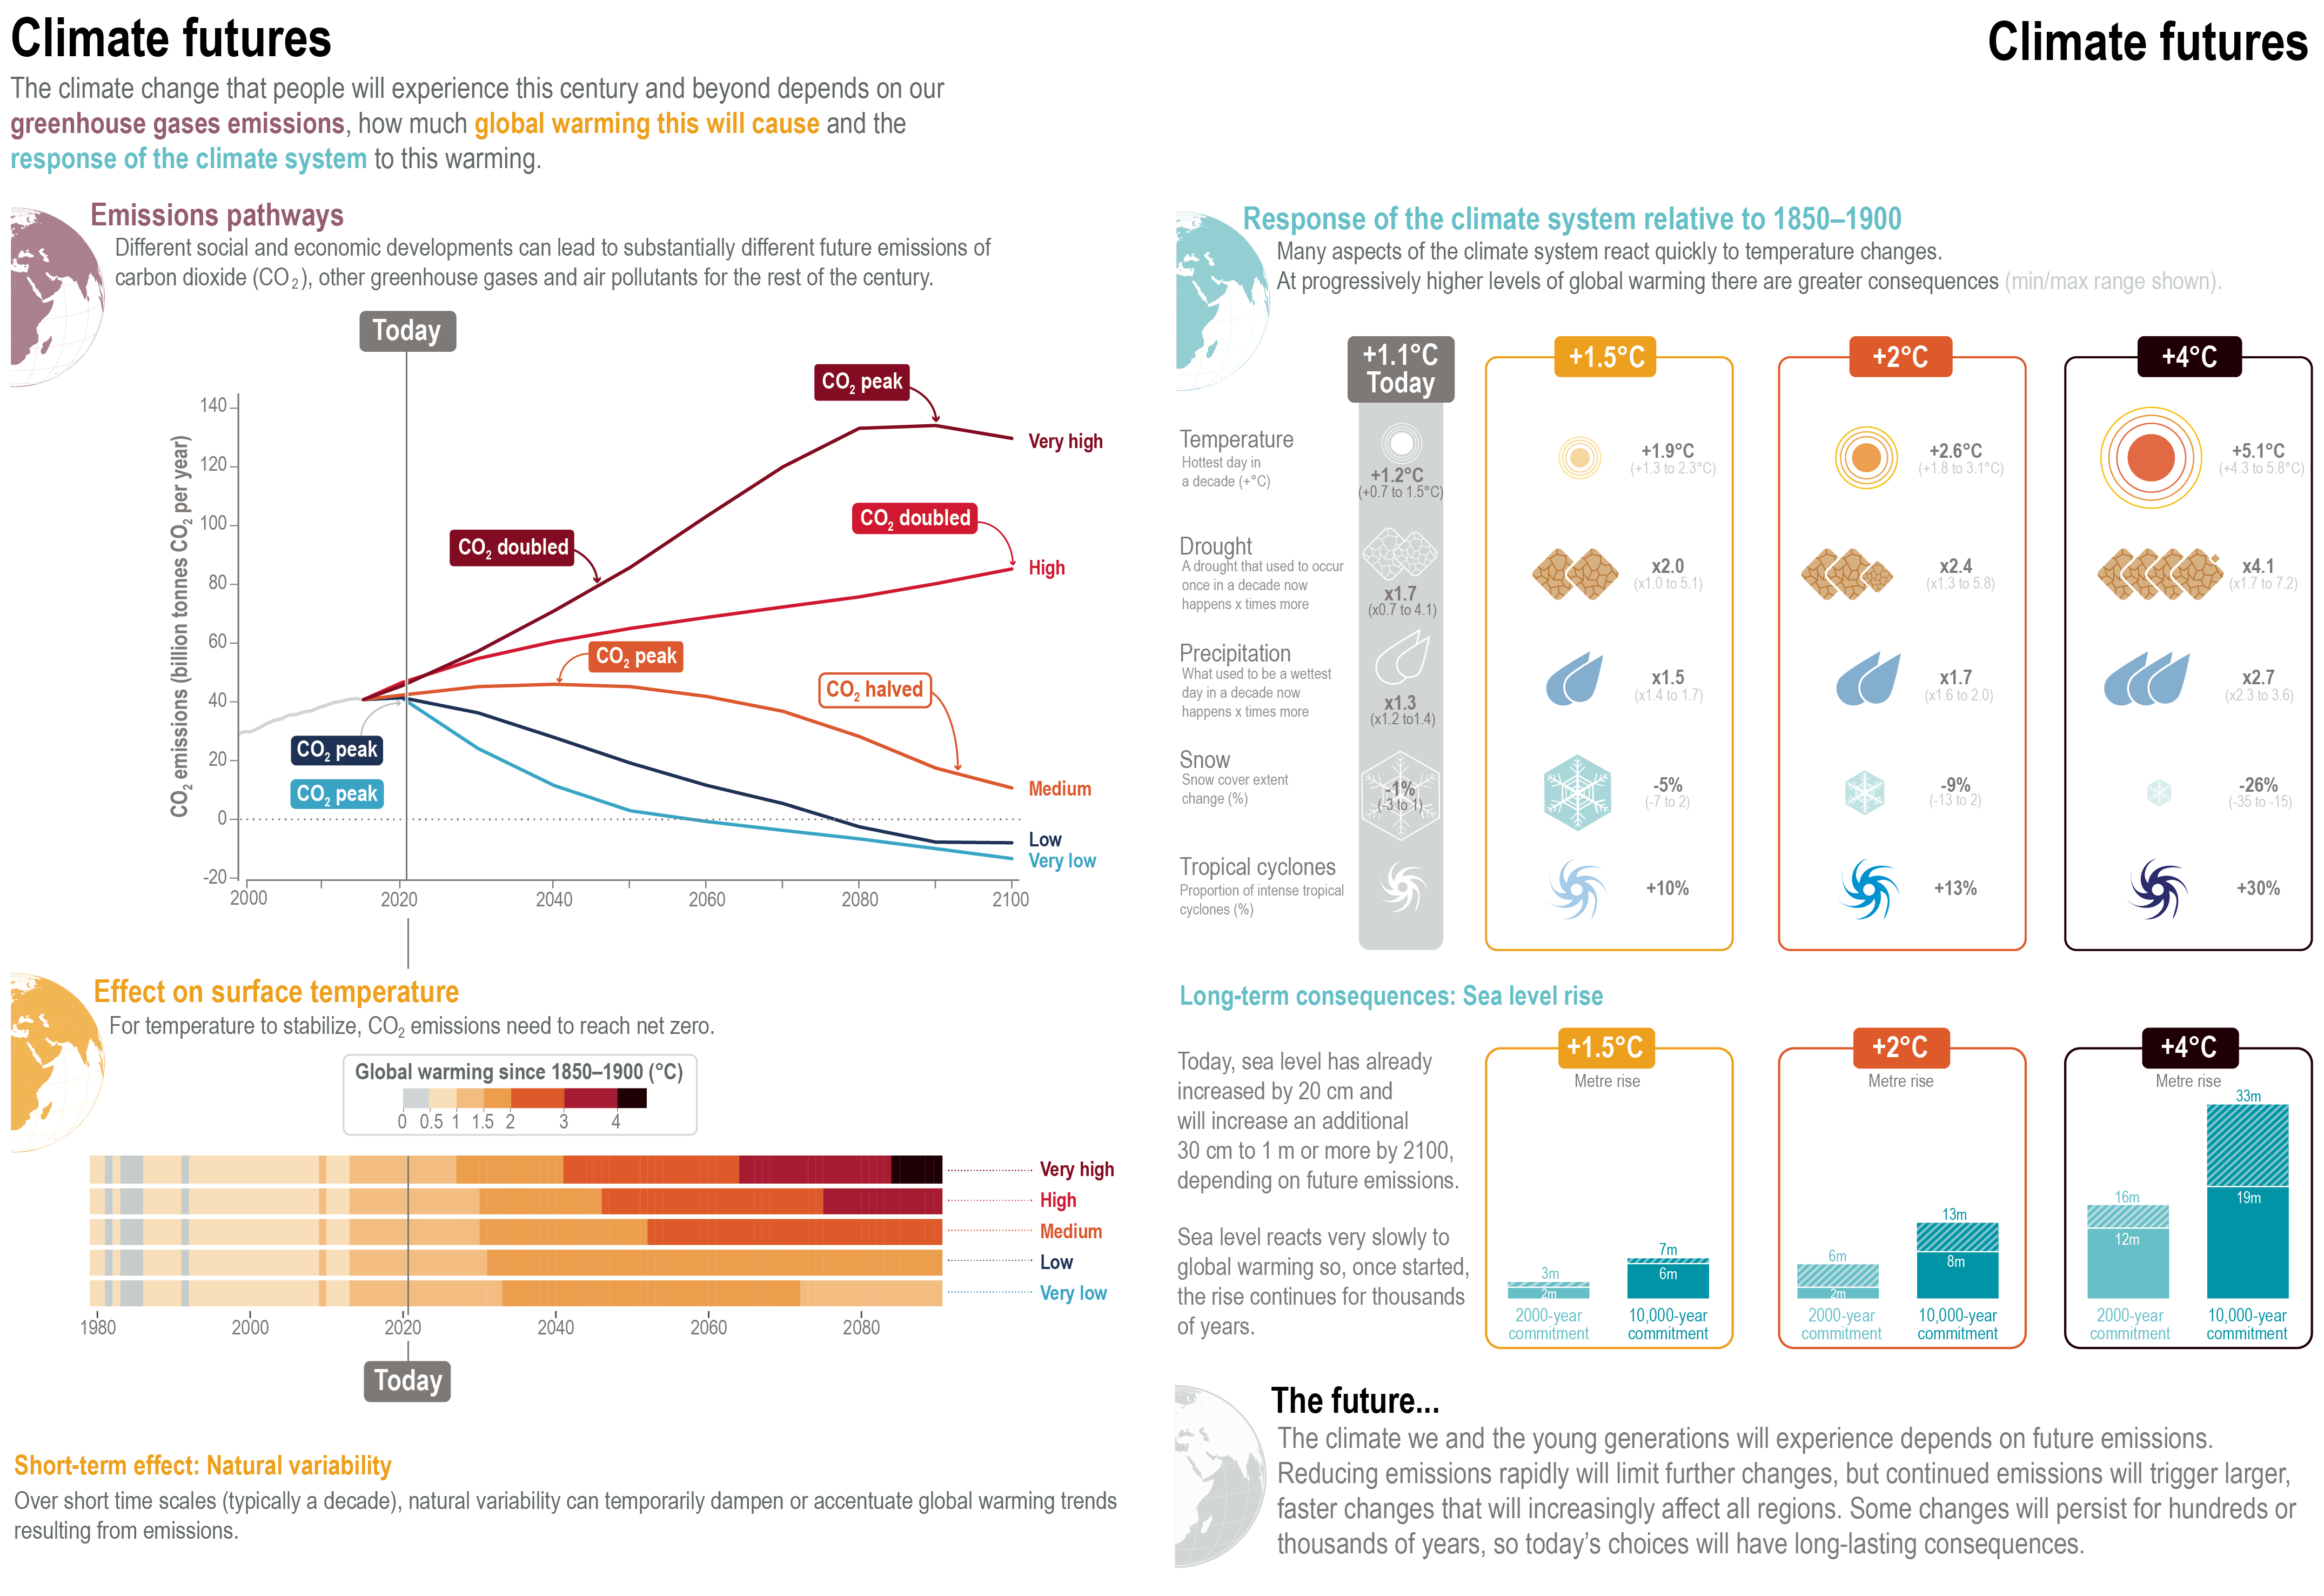
Figure caption
(top left) Annual emissions of CO2 for the five core Shared Socio-economic Pathway (SSP) scenarios (very low: SSP1-1.9, low: SSP1-2.6, intermediate: SSP2-4.5, high: SSP3-7.0, very high: SSP5-8.5). (bottom left) Projected warming for each of these emissions scenarios. (top right) Response of some selected climate variables to four levels of global warming (°C). Changes in the ‘Today’ column are based on a global warming level of 1°C. (bottom right) The long-term effect of each global warming level on sea level. See Section TS.1.3.1 for more detail on the SSP climate change scenarios. This infographic builds from several figures in the Technical Summary: Figure TS.4 (for top left panel), Figure TS.6 (bottom left), Figure TS.12 (top right) and Box TS.4, Figure 1b (bottom right).