Back chapter figures
Figure 1.1
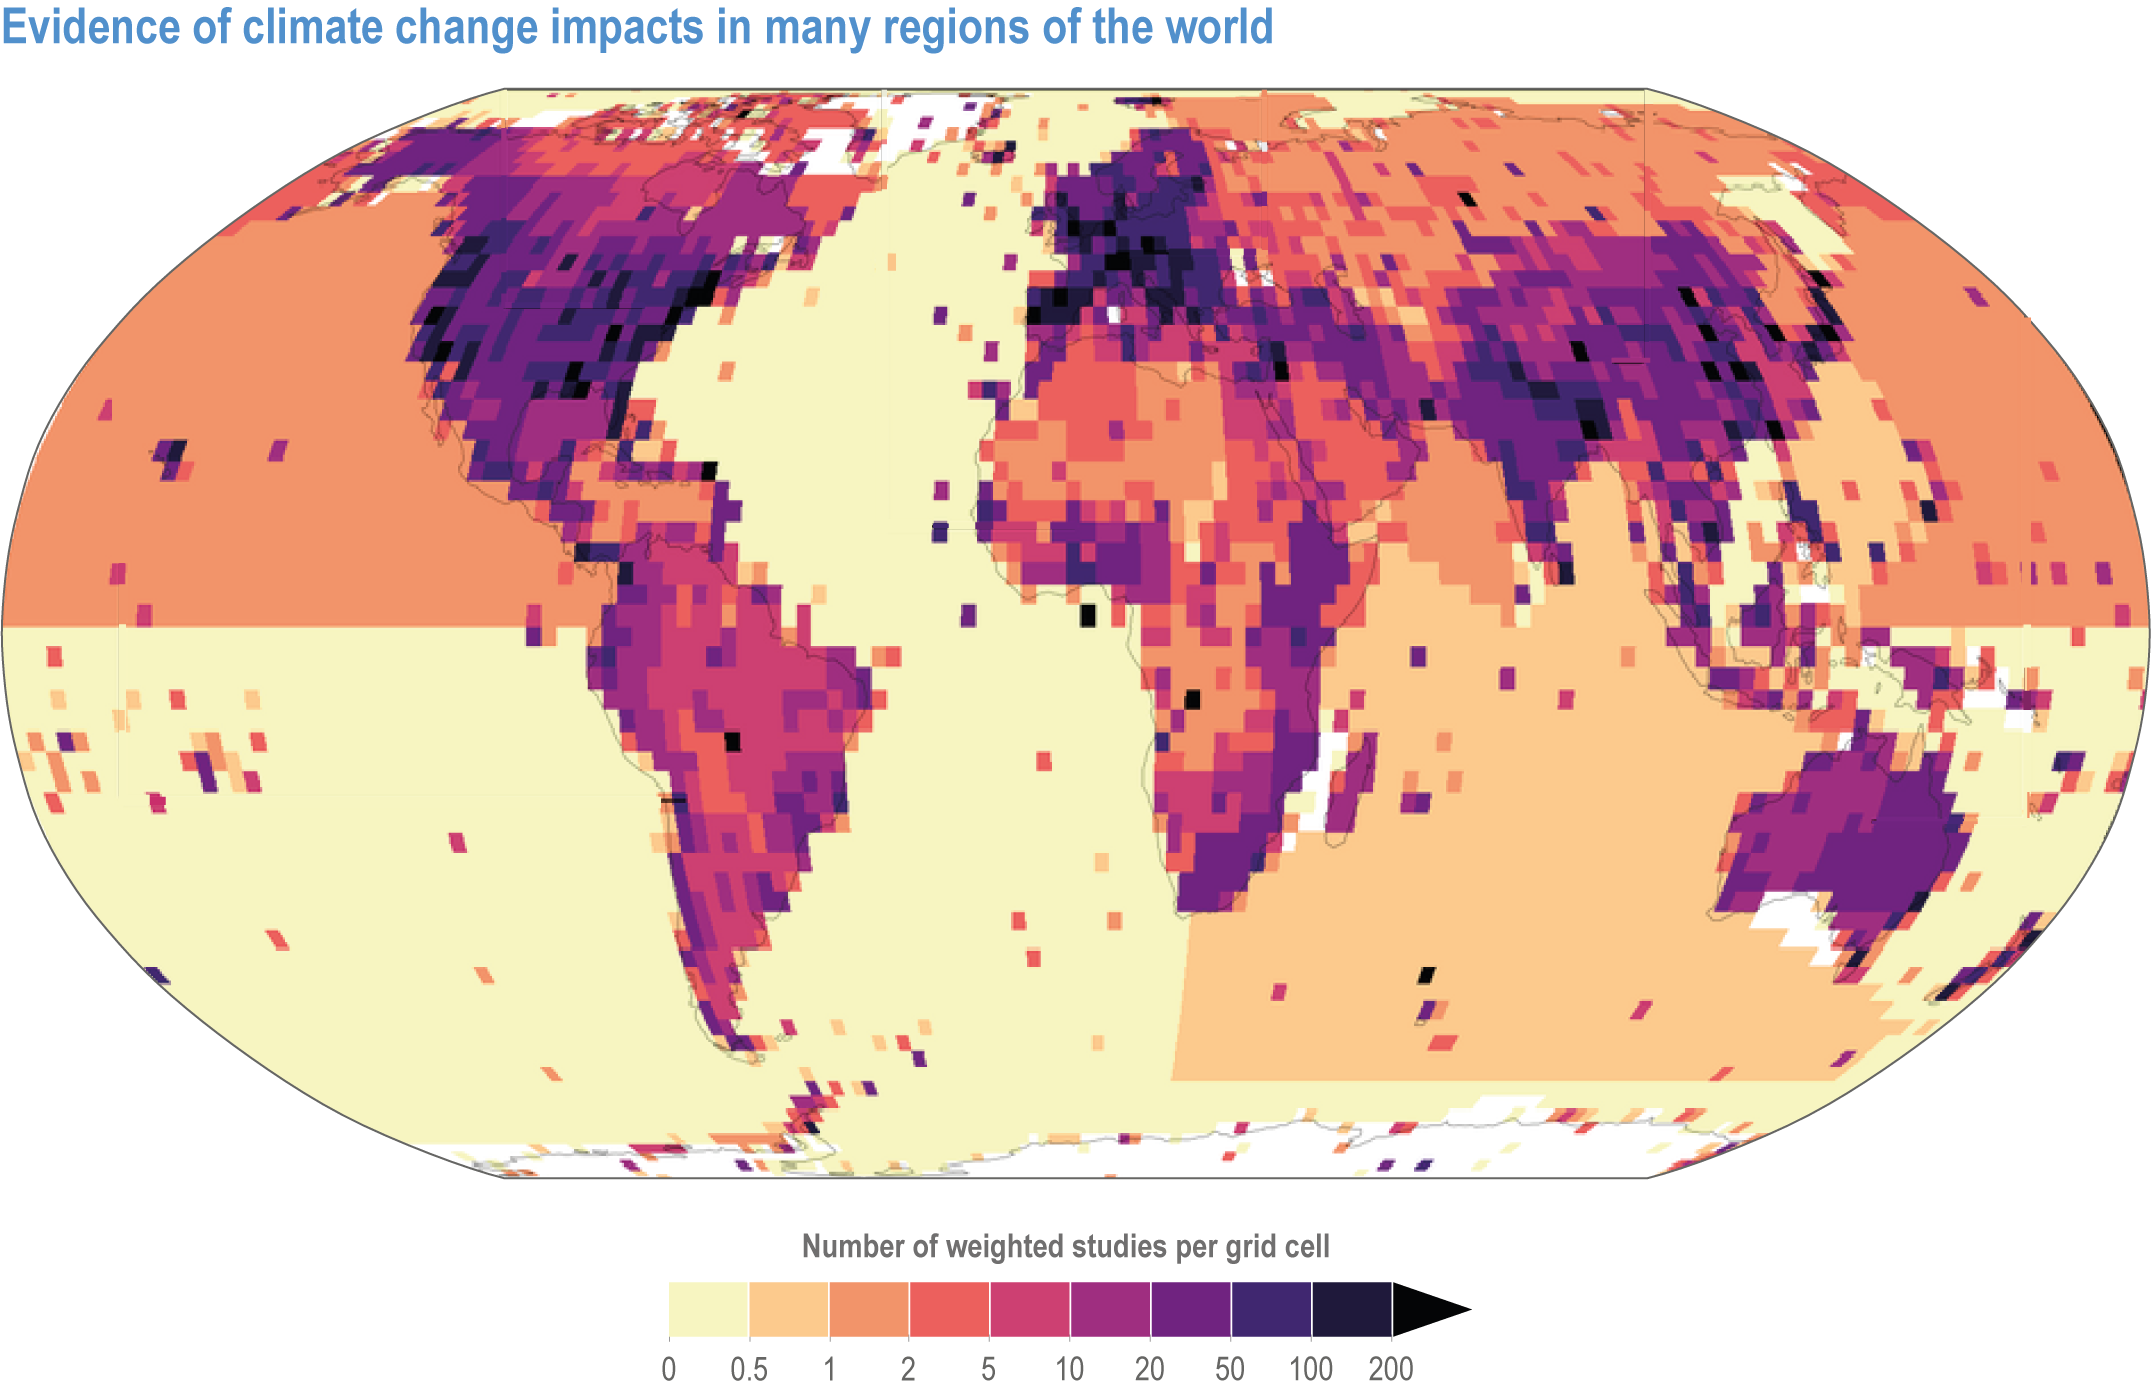
Figure caption
Figure 1.1 | Evidence of climate change impacts in many regions of the world. Global density map shows climate impact evidence, derived by machine-learning from 77,785 studies. Map colouring denotes the number of weighted studies per grid cell for all evidence on climate impacts (N= 77,785). Figure adopted from Callaghan et al. (2021).