Back chapter figures
Figure 1.3
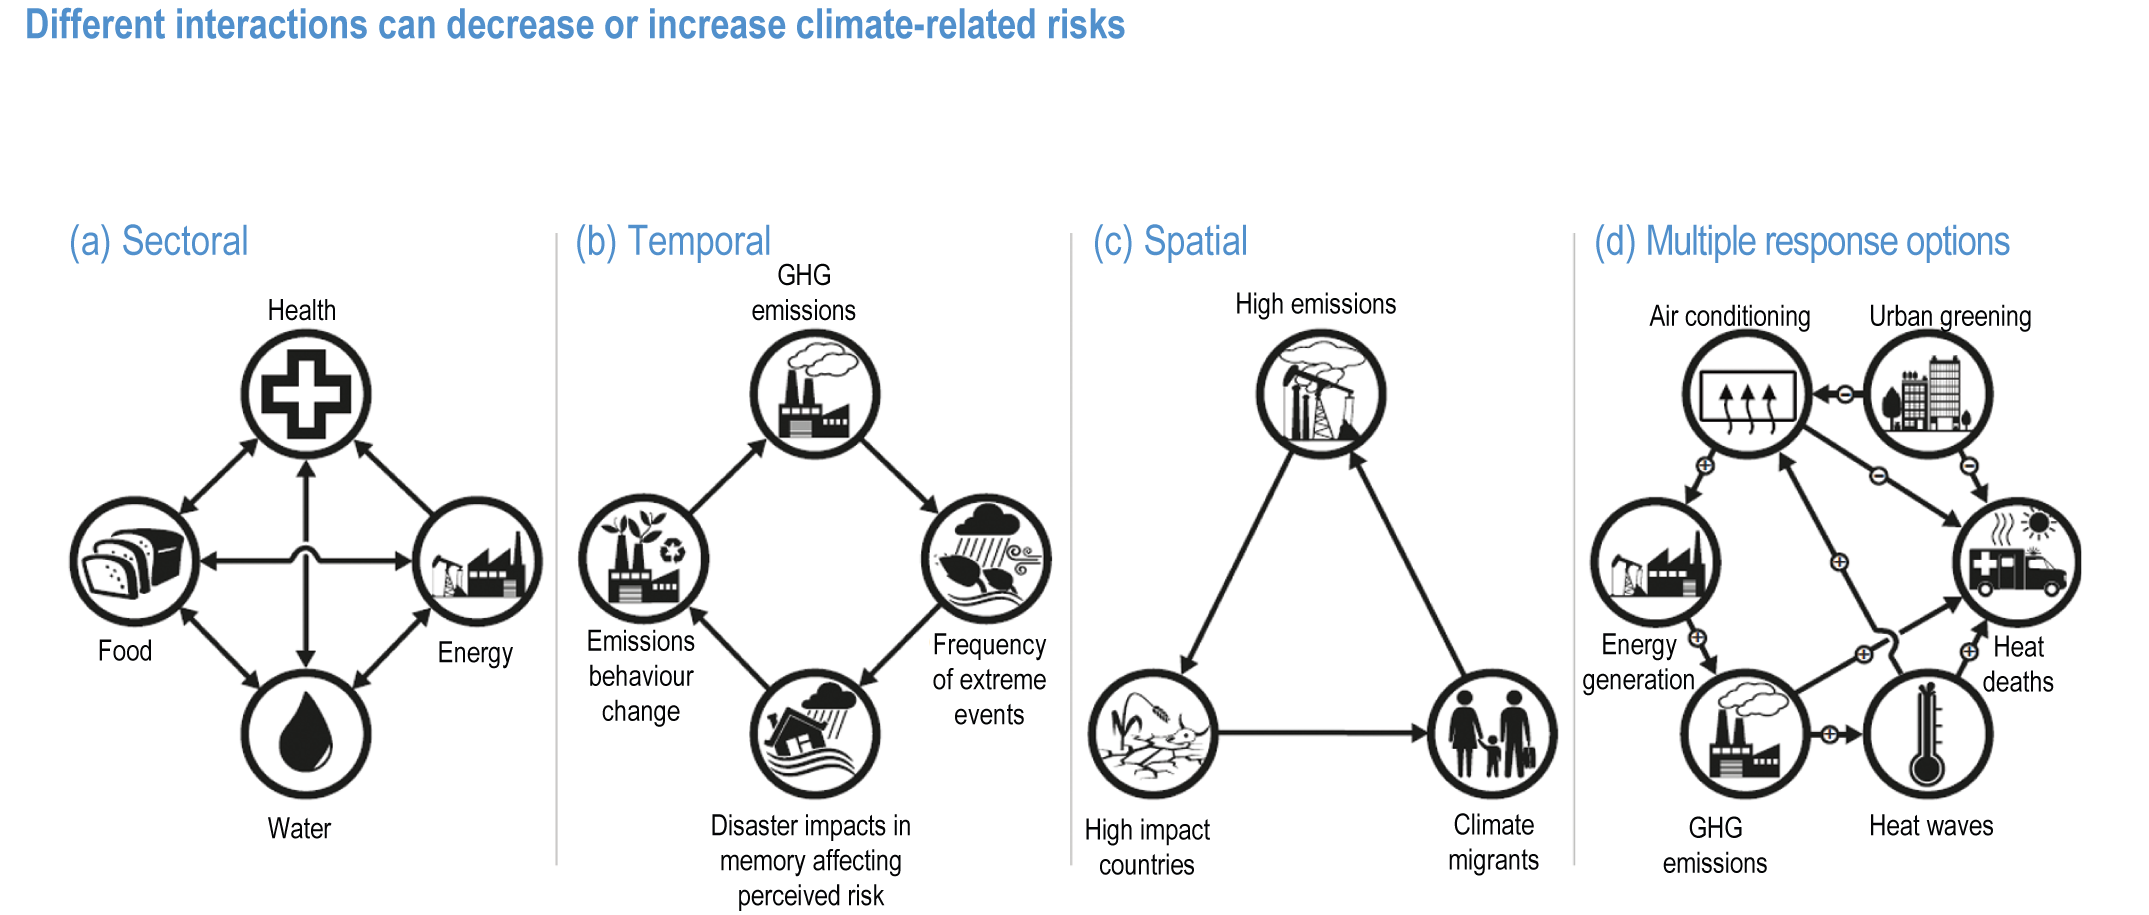
Figure caption
Figure 1.3 | Different interactions can decrease or increase climate-related risks. Key examples include interactions (a) among sectors, (b) through time, (c) across regions, or (d) between impacts and responses. The specific interactions indicated within each panel of this figure are illustrative, not comprehensive or indicative of relative importance. Source: (Simpson et. al. 2021)