Figure 10.2
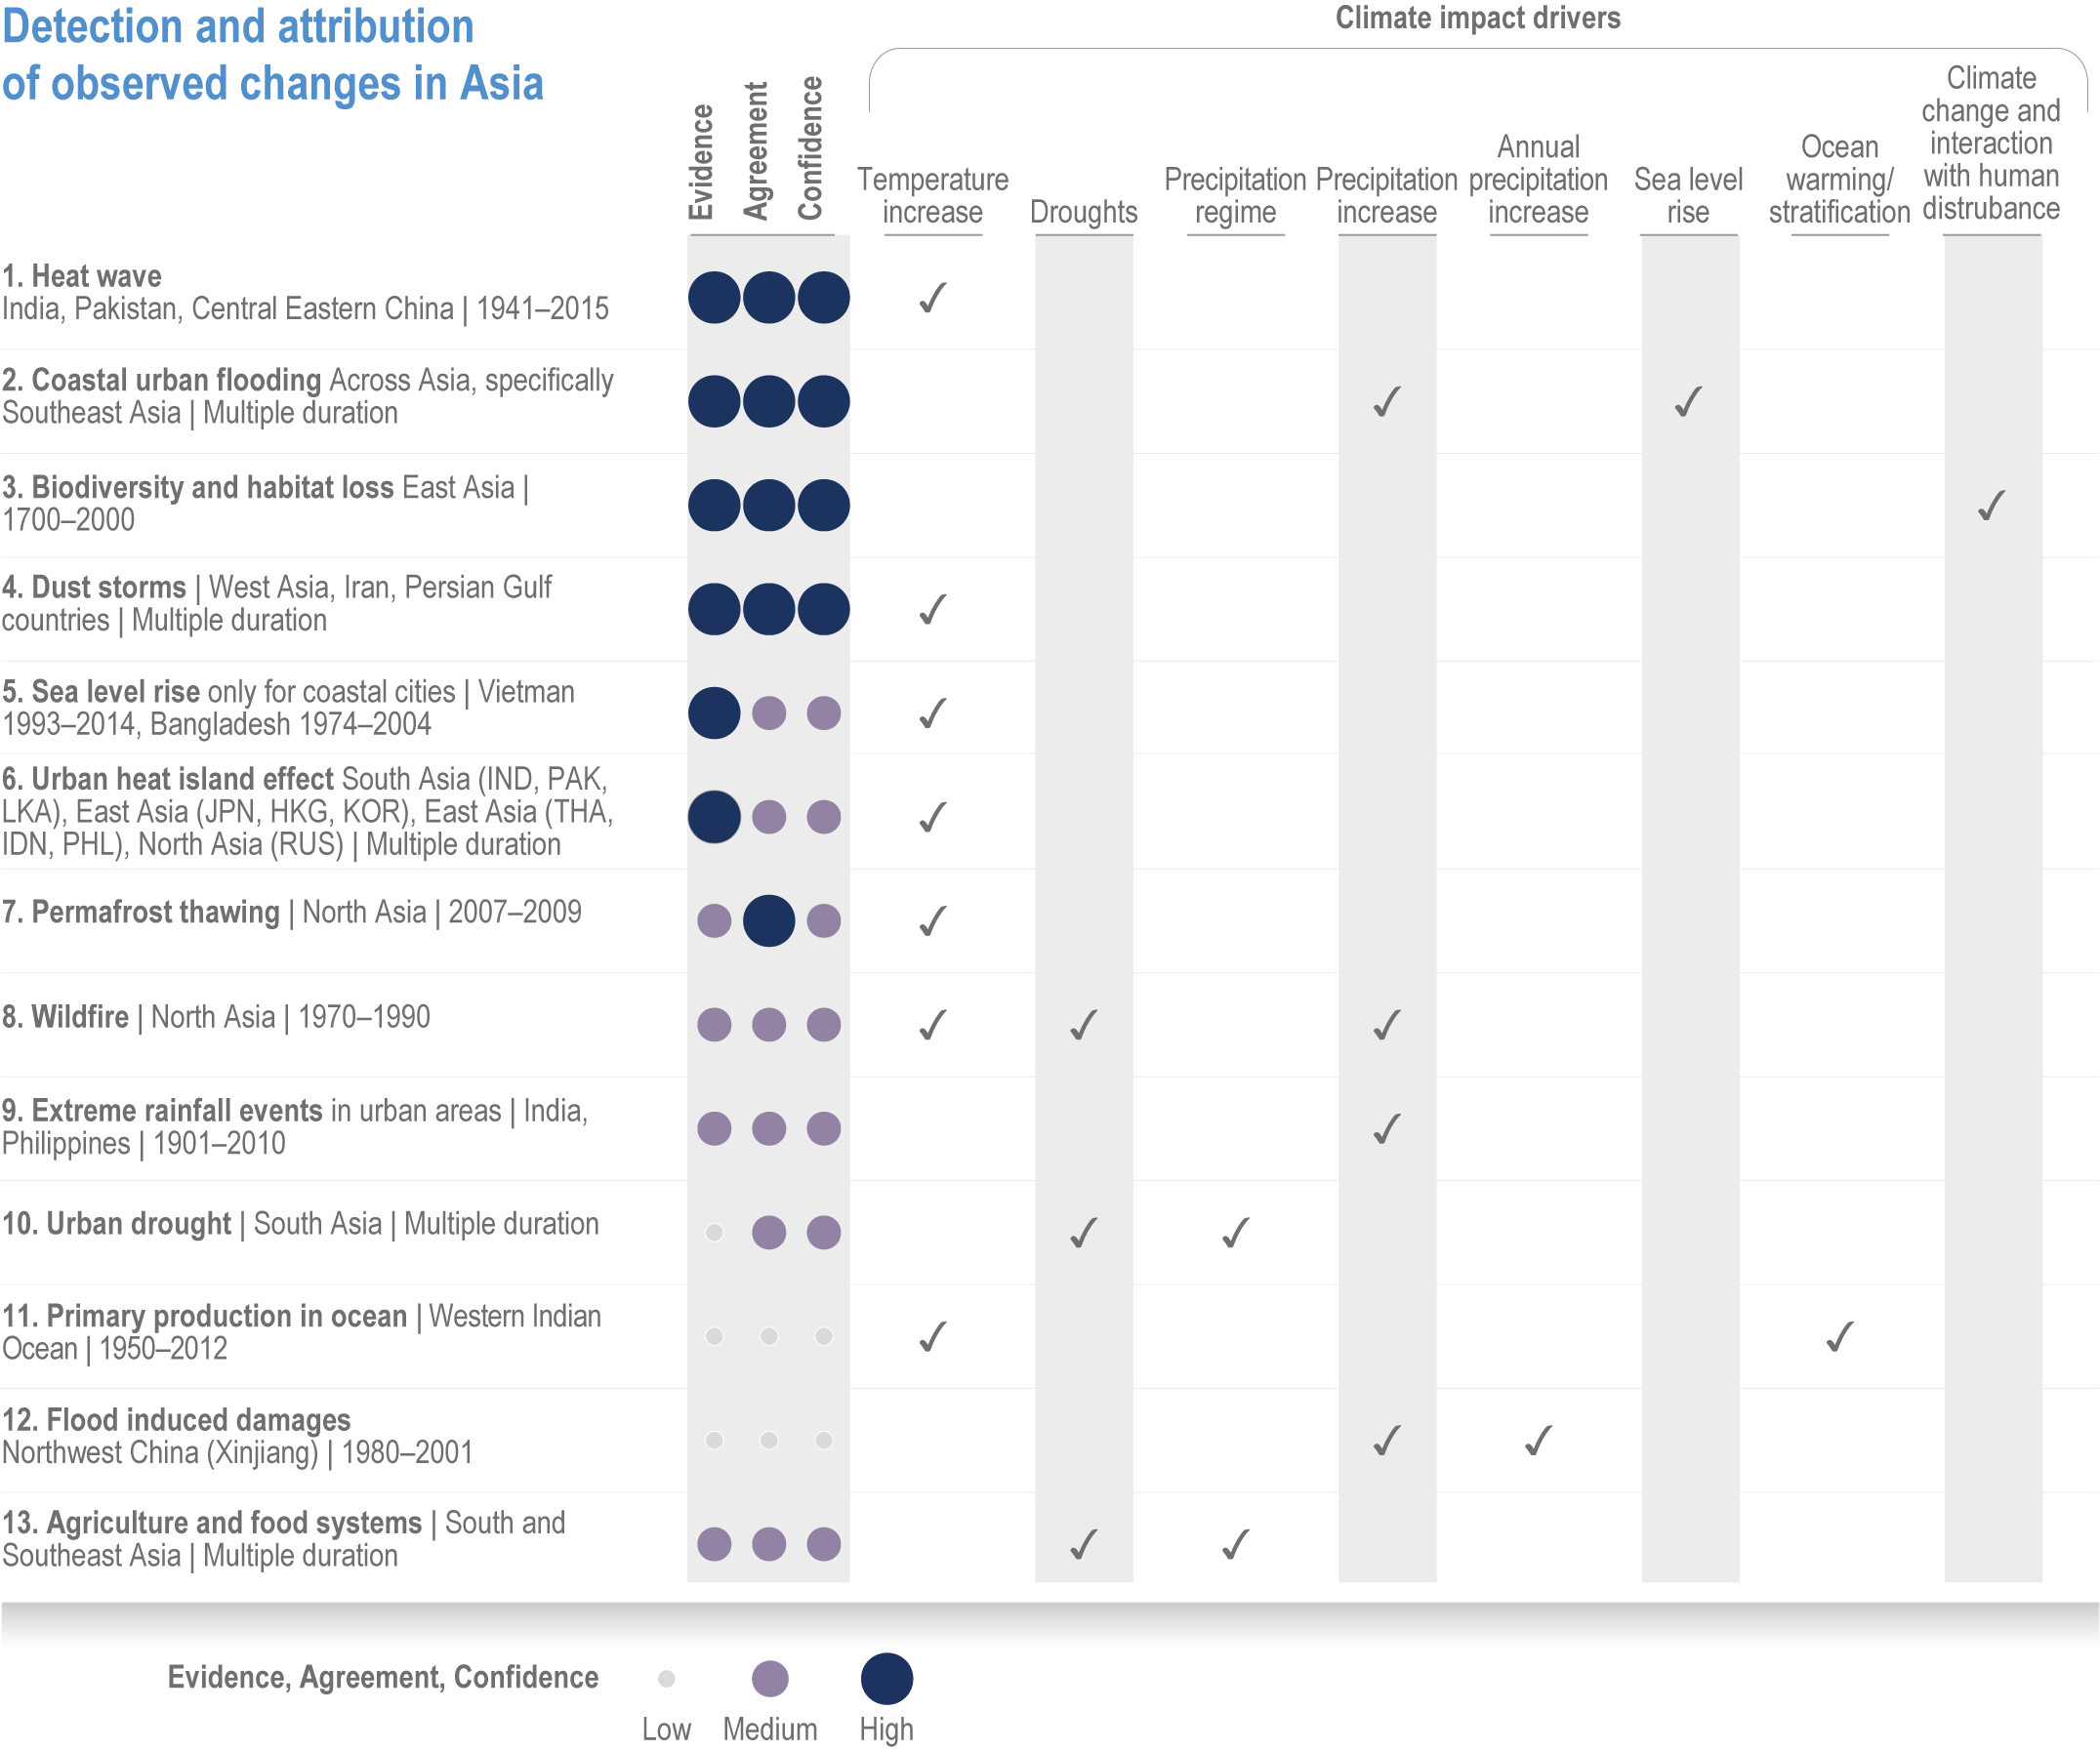
Figure caption
Figure 10.2 | Detection and attribution of observed changes in Asia. Levels of Evidence (E), Agreement (A) and Confidence (C) are ranked by High (H), Medium (M) or Low (L). CID: climate-impact driver. References: (1) Heatwaves (Mishra et al., 2015; Rohini et al., 2016; Chen and Li, 2017; Panda et al., 2017; Ross et al., 2018); (2) Coastal urban flooding (Dulal, 2019); (3) Biodiversity and habitat loss (Wan et al., 2019); (4) Dust storms (Kelley et al., 2015; Yu et al., 2015; Alizadeh-Choobari et al., 2016; Nabavi et al., 2016); (5) Sea level rise (only for coastal cities) (Brammer, 2014; Shahid et al., 2016; Hens et al., 2018); (6) Urban heat island (UHI) effect (Choi et al., 2014; Santamouris, 2015; Estoque et al., 2017; Ranagalage et al., 2017; Kotharkar et al., 2018; Li et al., 2018a; Hong et al., 2019c); (7) Permafrost thawing (Shiklomanov et al., 2017a; Biskaborn et al., 2019); (8) Wildfire (Schaphoff et al., 2016; Brazhnik et al., 2017); (9) Extreme rainfall events (in urban areas) (Ali et al., 2014); (10) Urban drought (Gu et al., 2015; Pervin et al., 2020); (11) Primary production in ocean (Roxy et al., 2016); (12) Flood-induced damages (Fengqing et al., 2005); (13) Agriculture and food systems (Heino et al., 2018; Prabnakorn et al., 2018).