Back chapter figures
Figure 11.1
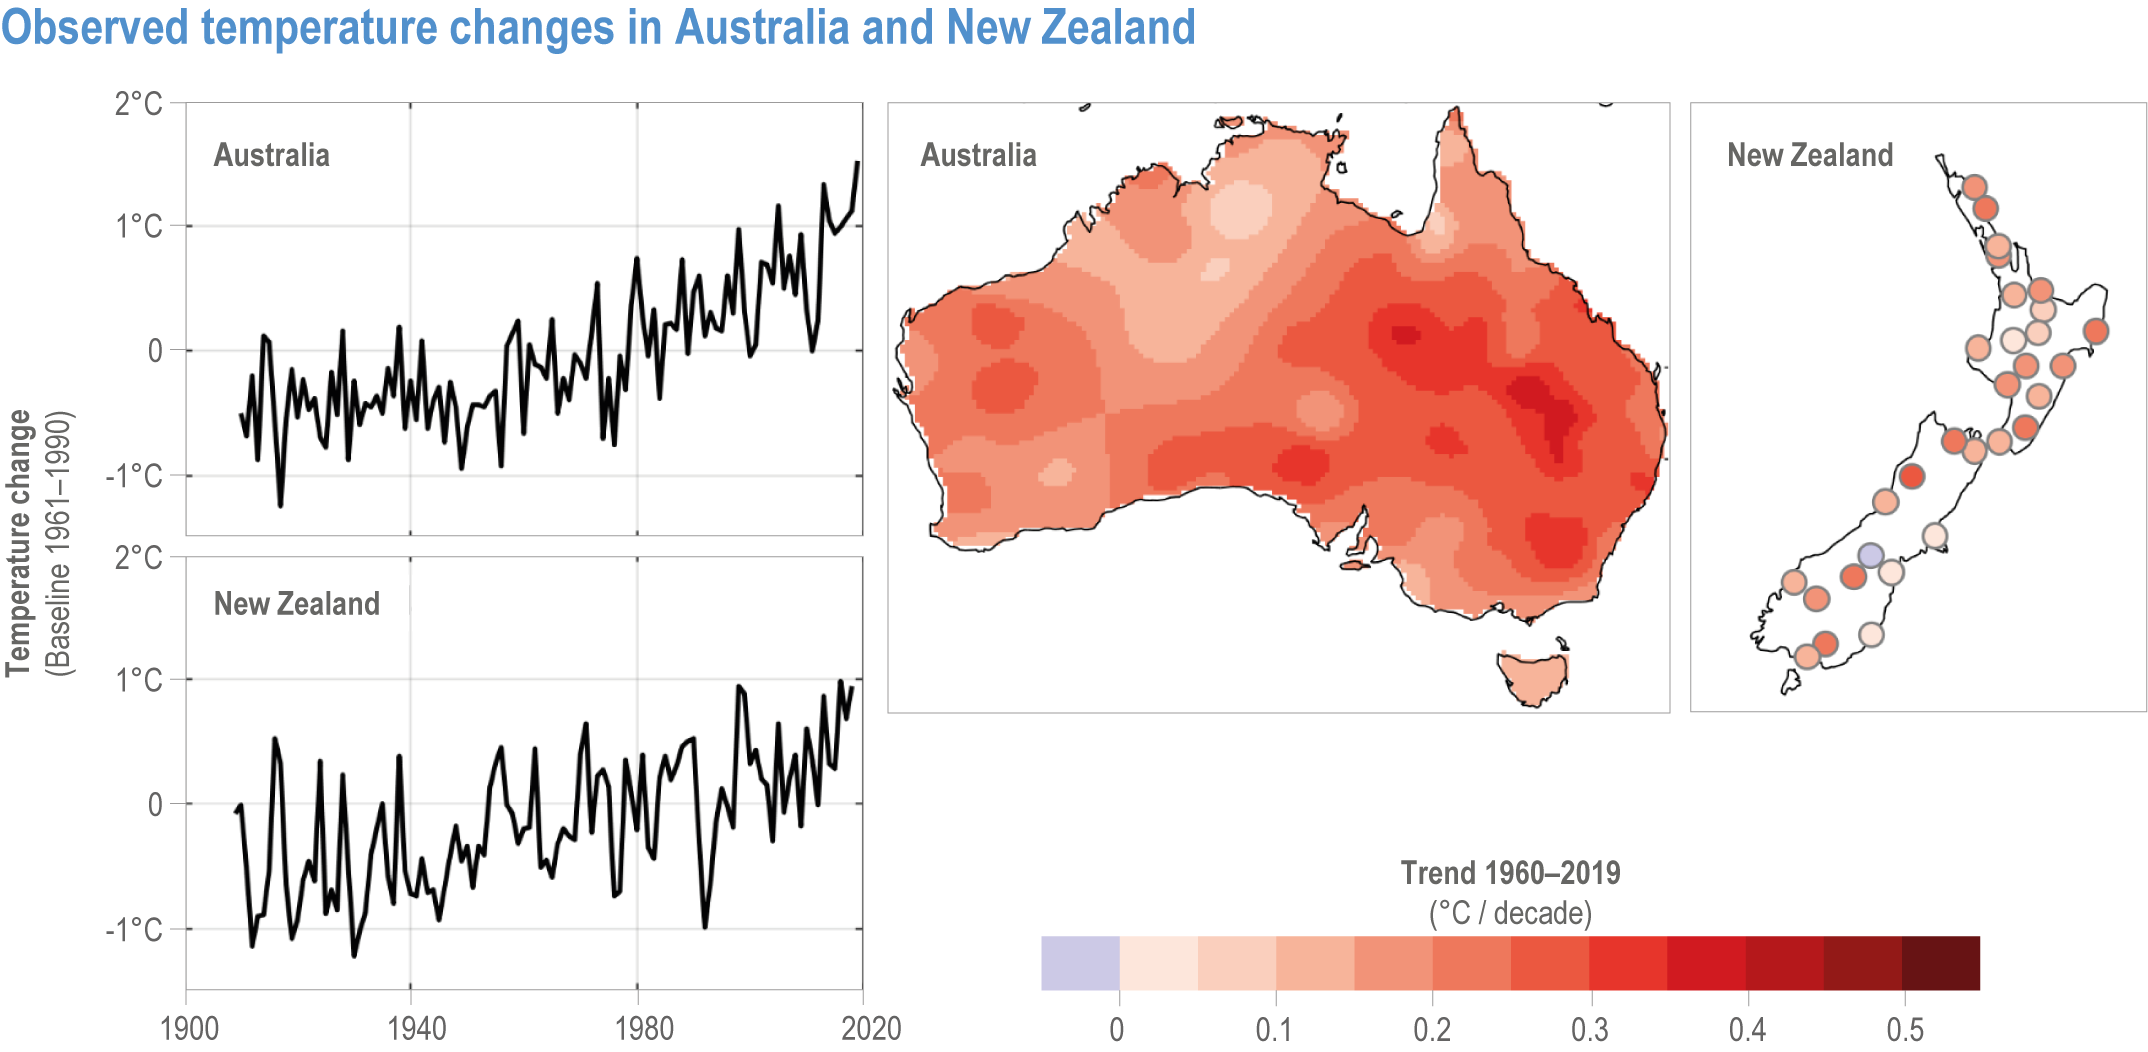
Figure caption
Figure 11.1 | Observed temperature changes in Australia and New Zealand. Annual temperature change time series are shown for 1910–2019. Mean annual temperature trend maps are shown for 1960–2019 using contours for Australia and individual sites for New Zealand. Data courtesy of BOM and NIWA.