Back chapter figures
Figure 11.4
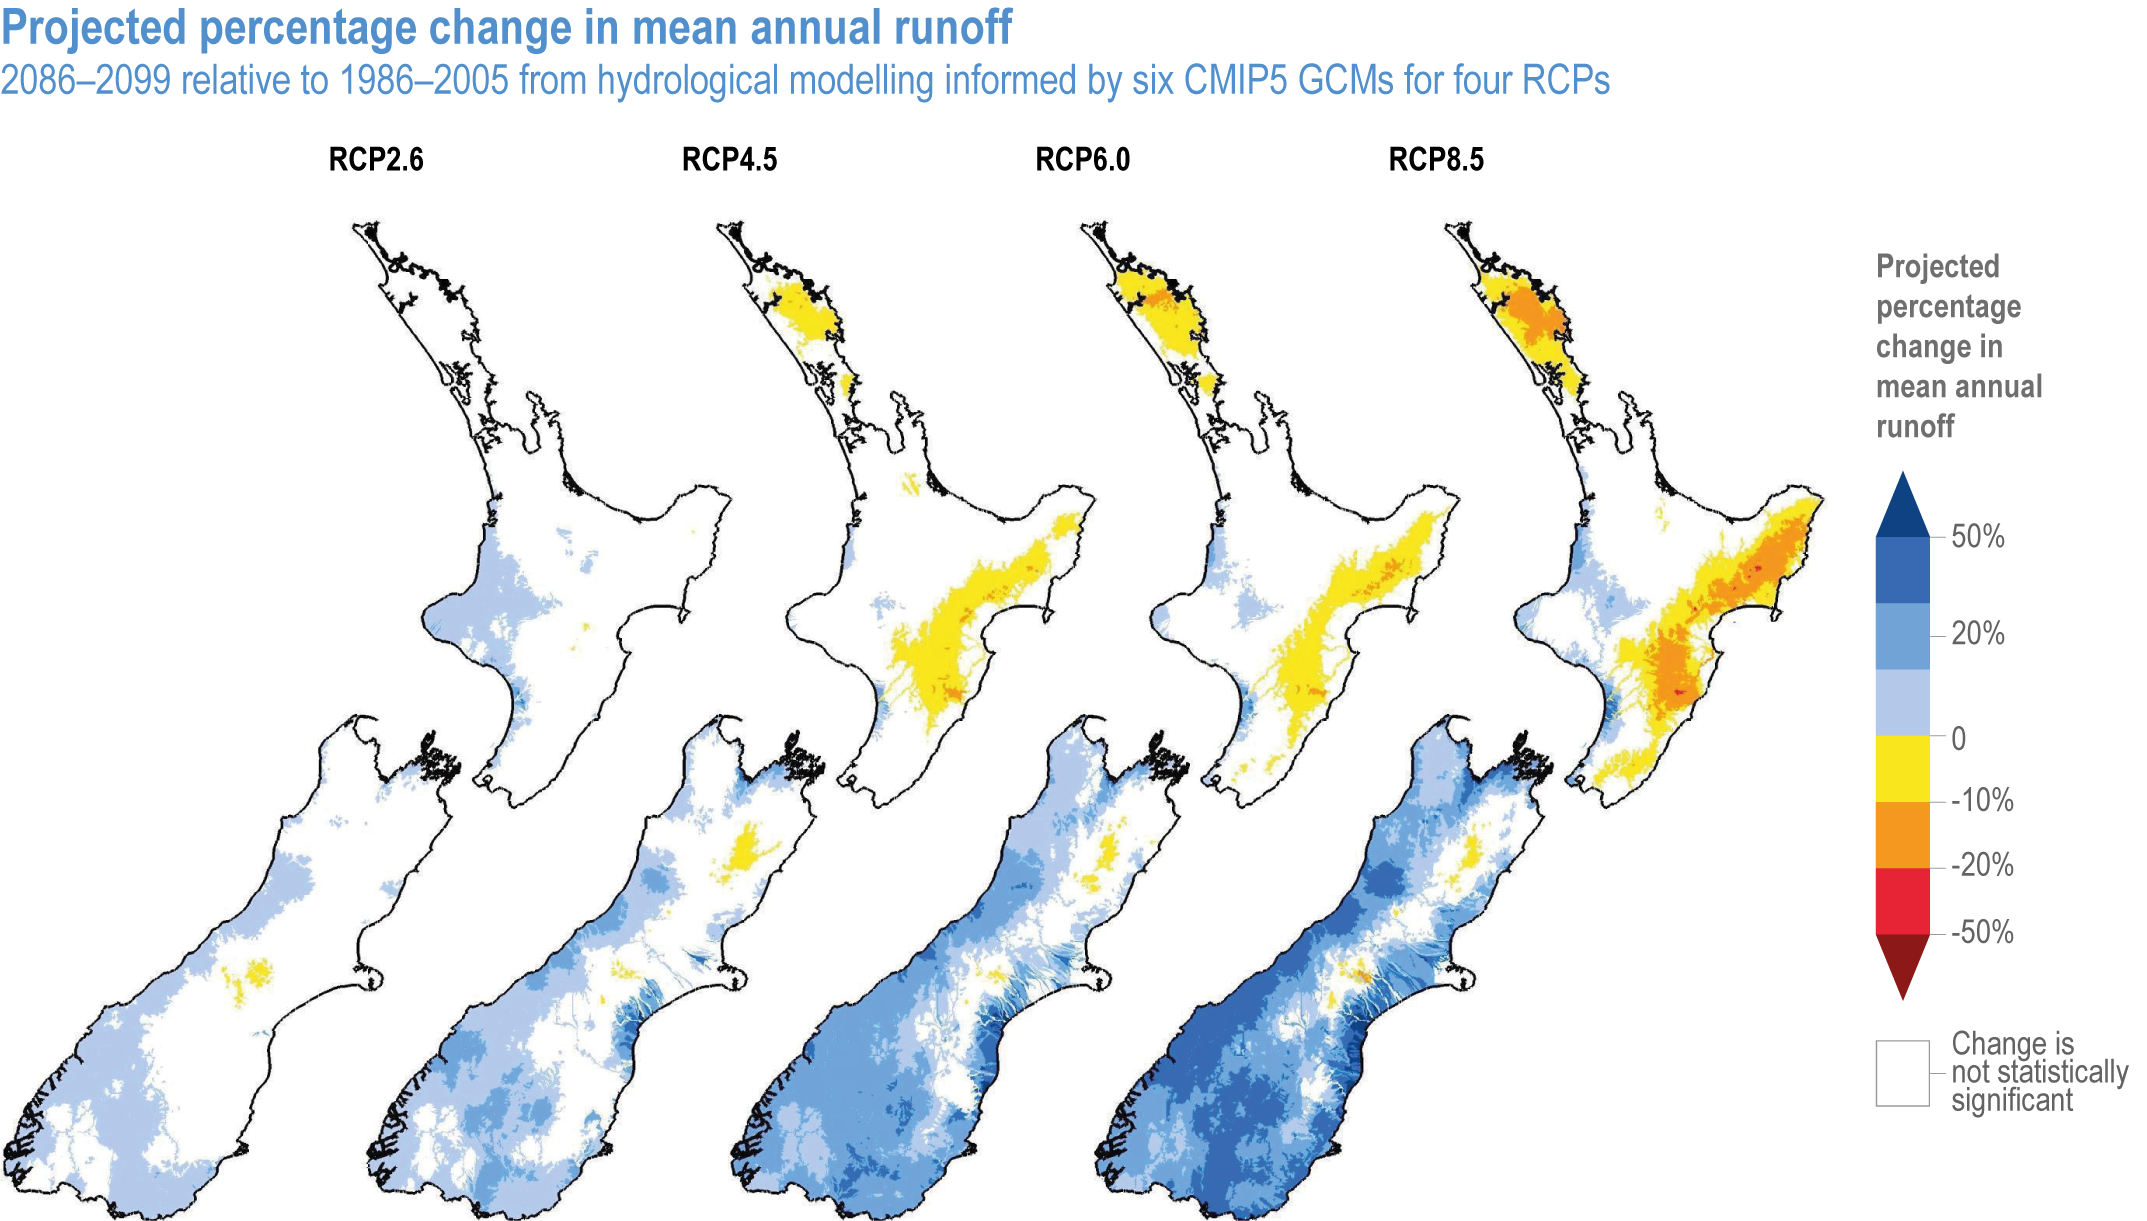
Figure caption
Figure 11.4 | Projected percentage change in mean annual runoff for 2086–2099 relative to 1986–2005 from hydrological modelling informed by six CMIP5 GCMs for four RCPs. Maps show median projection from the six modelling runs. White indicates that the change is not statistically significant. Source: (D. Collins, 2020).