Figure Box 11.2.1
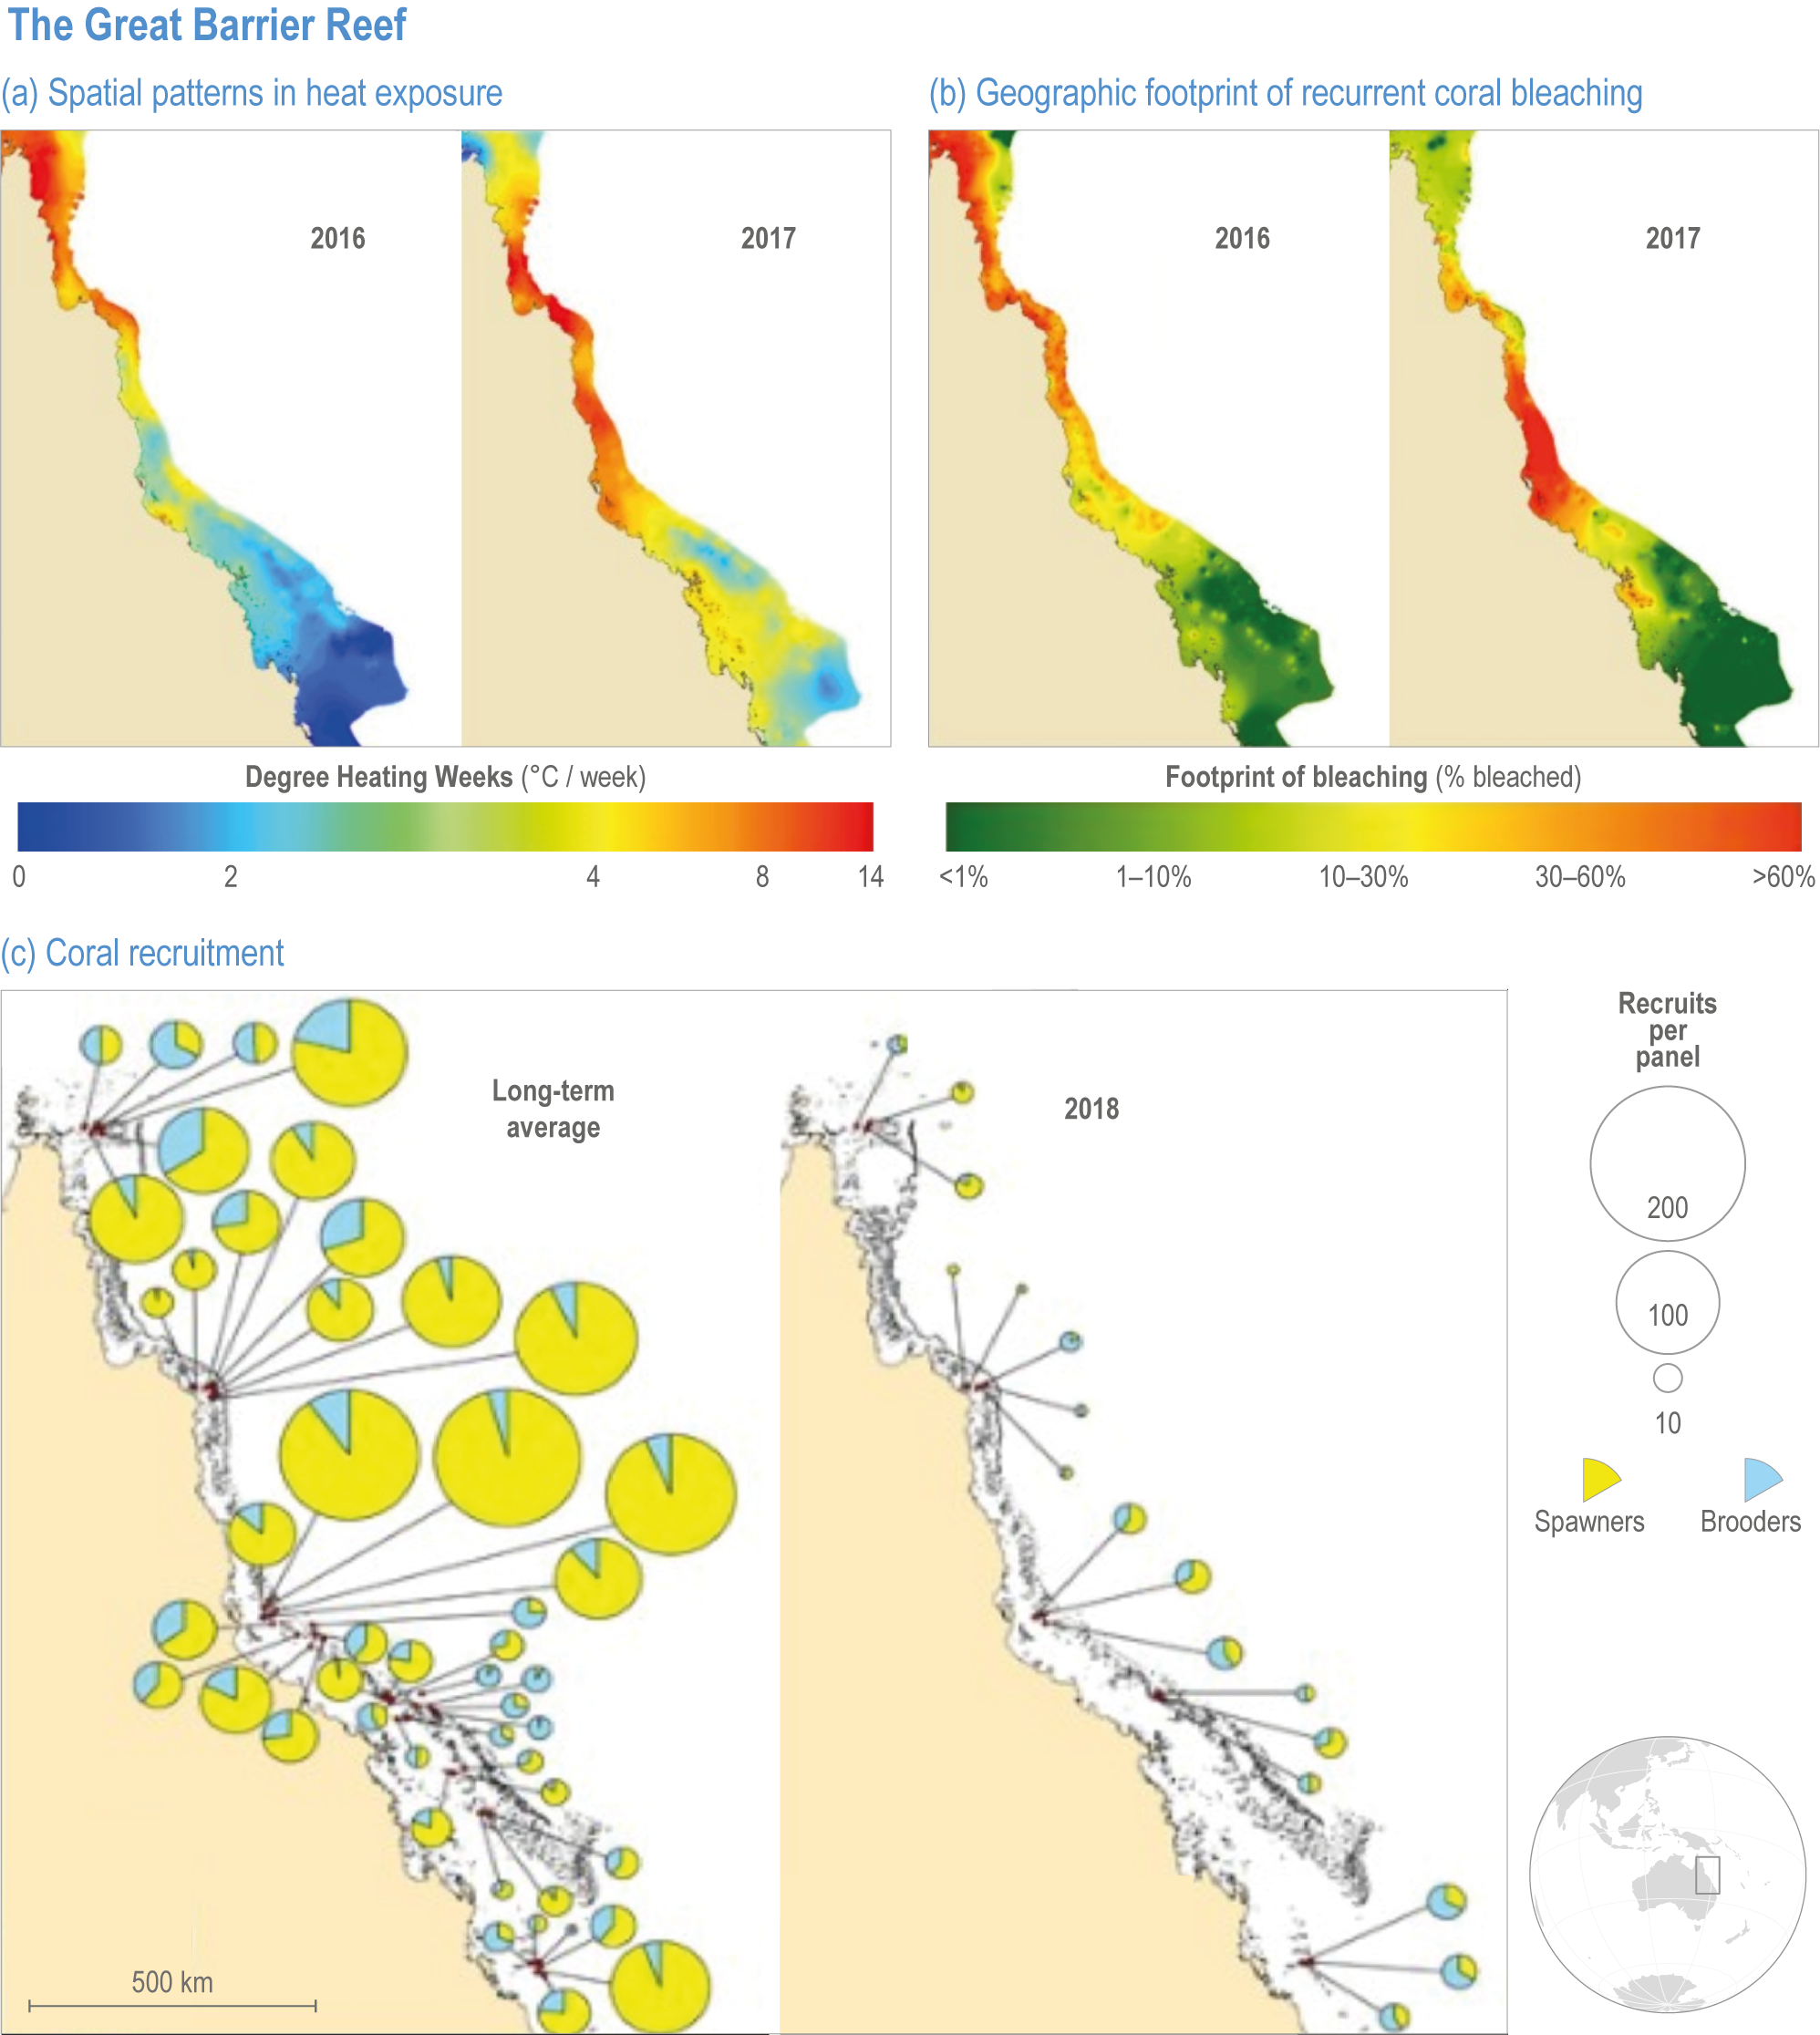
Figure caption
Figure Box 11.2.1 | Top panels: spatial patterns in heat exposure along the GBR in 2016 (left pair) and 2017 (right pair), measured from satellites as Degree Heating Weeks (DHW, °C-weeks). Middle panels: geographic footprint of recurrent coral bleaching in 2016 (left) and again in 2017 (right), measured by aerial assessments of individual reefs (adapted from (Hughes et al., 2019c)]). Bottom panels: density of coral recruits (mean per recruitment panel on each reef), measured over three decades, from 1996 to 2016 (n = 47 reefs, 1784 panels) (left), compared to the density of coral recruits in 2018 after the mass mortality of corals in 2016 and 2017 due to the back-to-back bleaching events (n = 17 reefs, 977 panels) (right). The area of each circle is scaled to the overall recruit density of spawners and brooders combined. Yellow and blue indicate the proportion of spawners and brooders respectively (from (Hughes et al., 2019b)]).