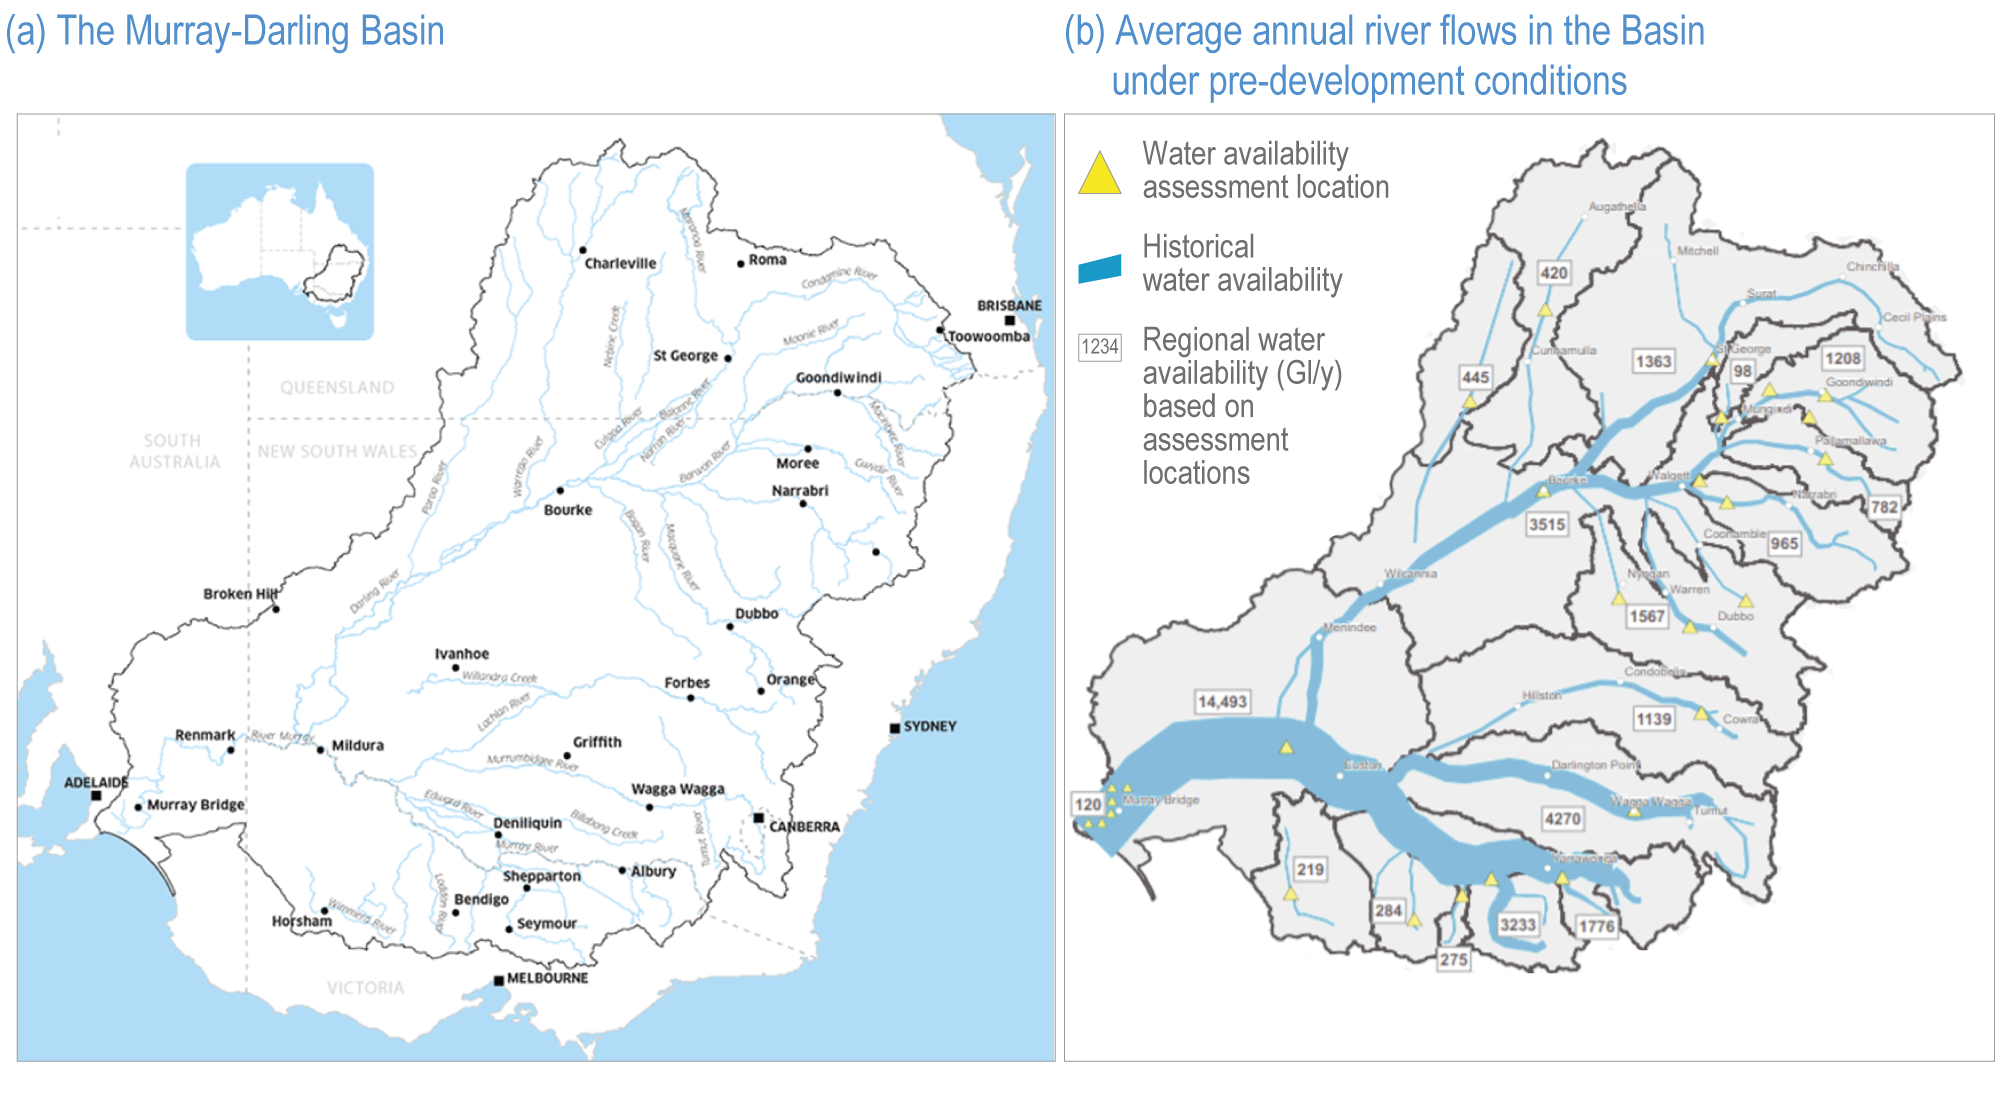
Figure Box 11.3.1 | (A) The Murray-Darling Basin, and (B) average annual river flows in the basin under pre-development conditions (from (CSIRO, 2008) showing that most of the runoff comes from the southeastern highlands. The borders show key drainage basins.