Back chapter figures
Figure 12.4
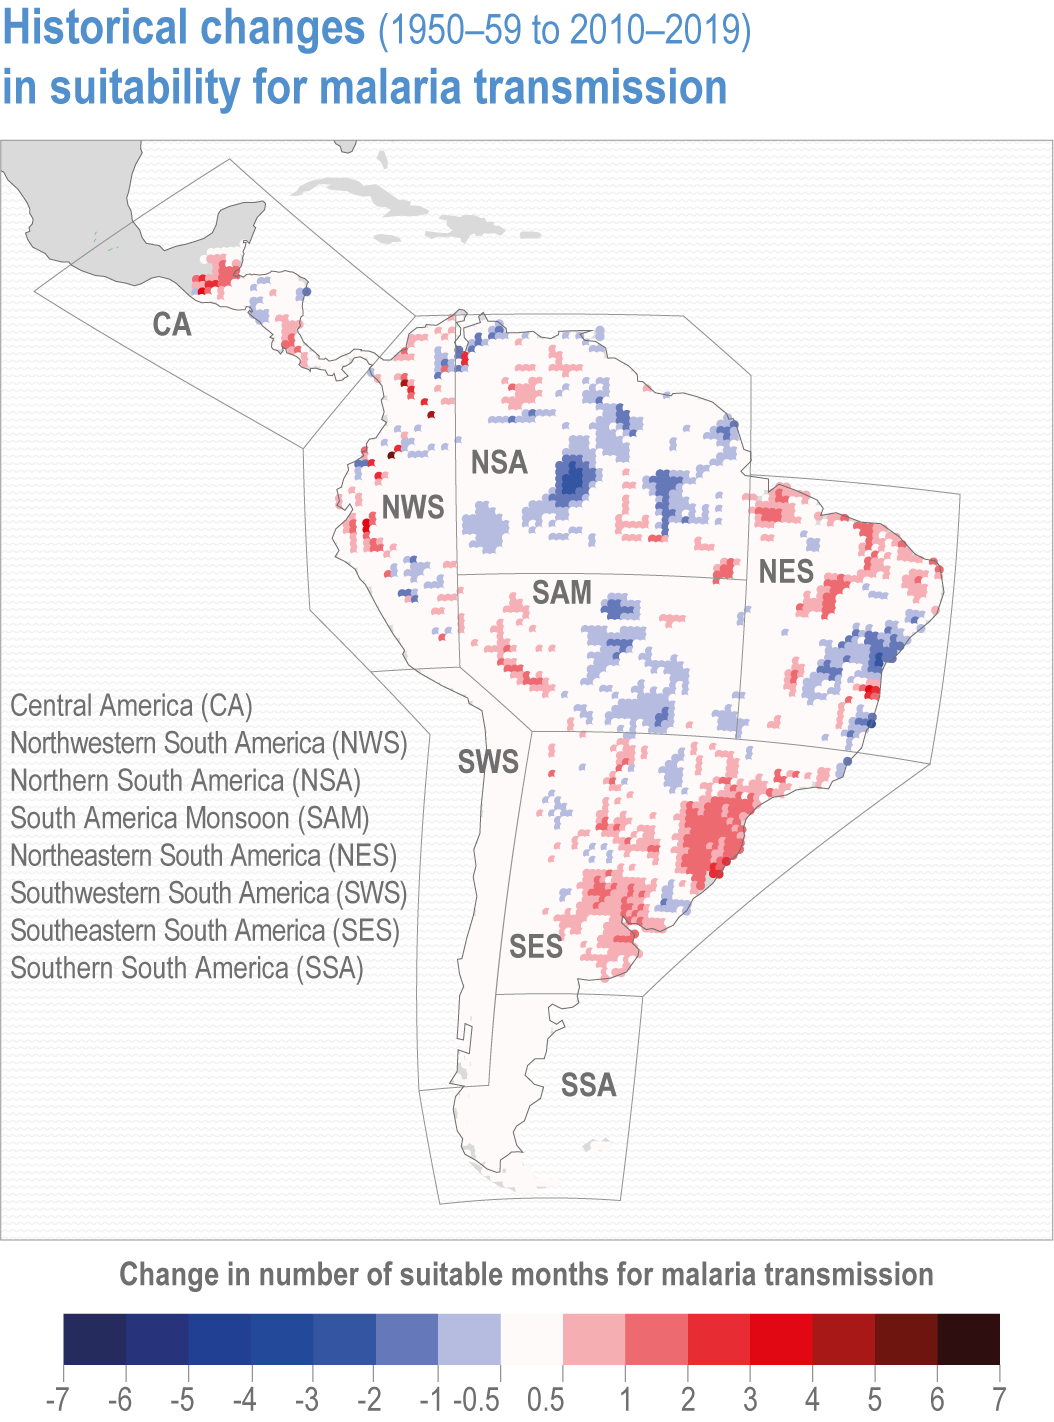
Figure caption
Figure 12.4 | Change in average number of months in a given year suitable for malaria transmission by Plasmodium falciparum, from 1950–1959 to 2010–2019. The threshold-based model used incorporates precipitation accumulation, average temperature and relative humidity (Grover-Kopec et al., 2006; Romanello et al., 2021).