Back chapter figures
Figure 13.4a-f
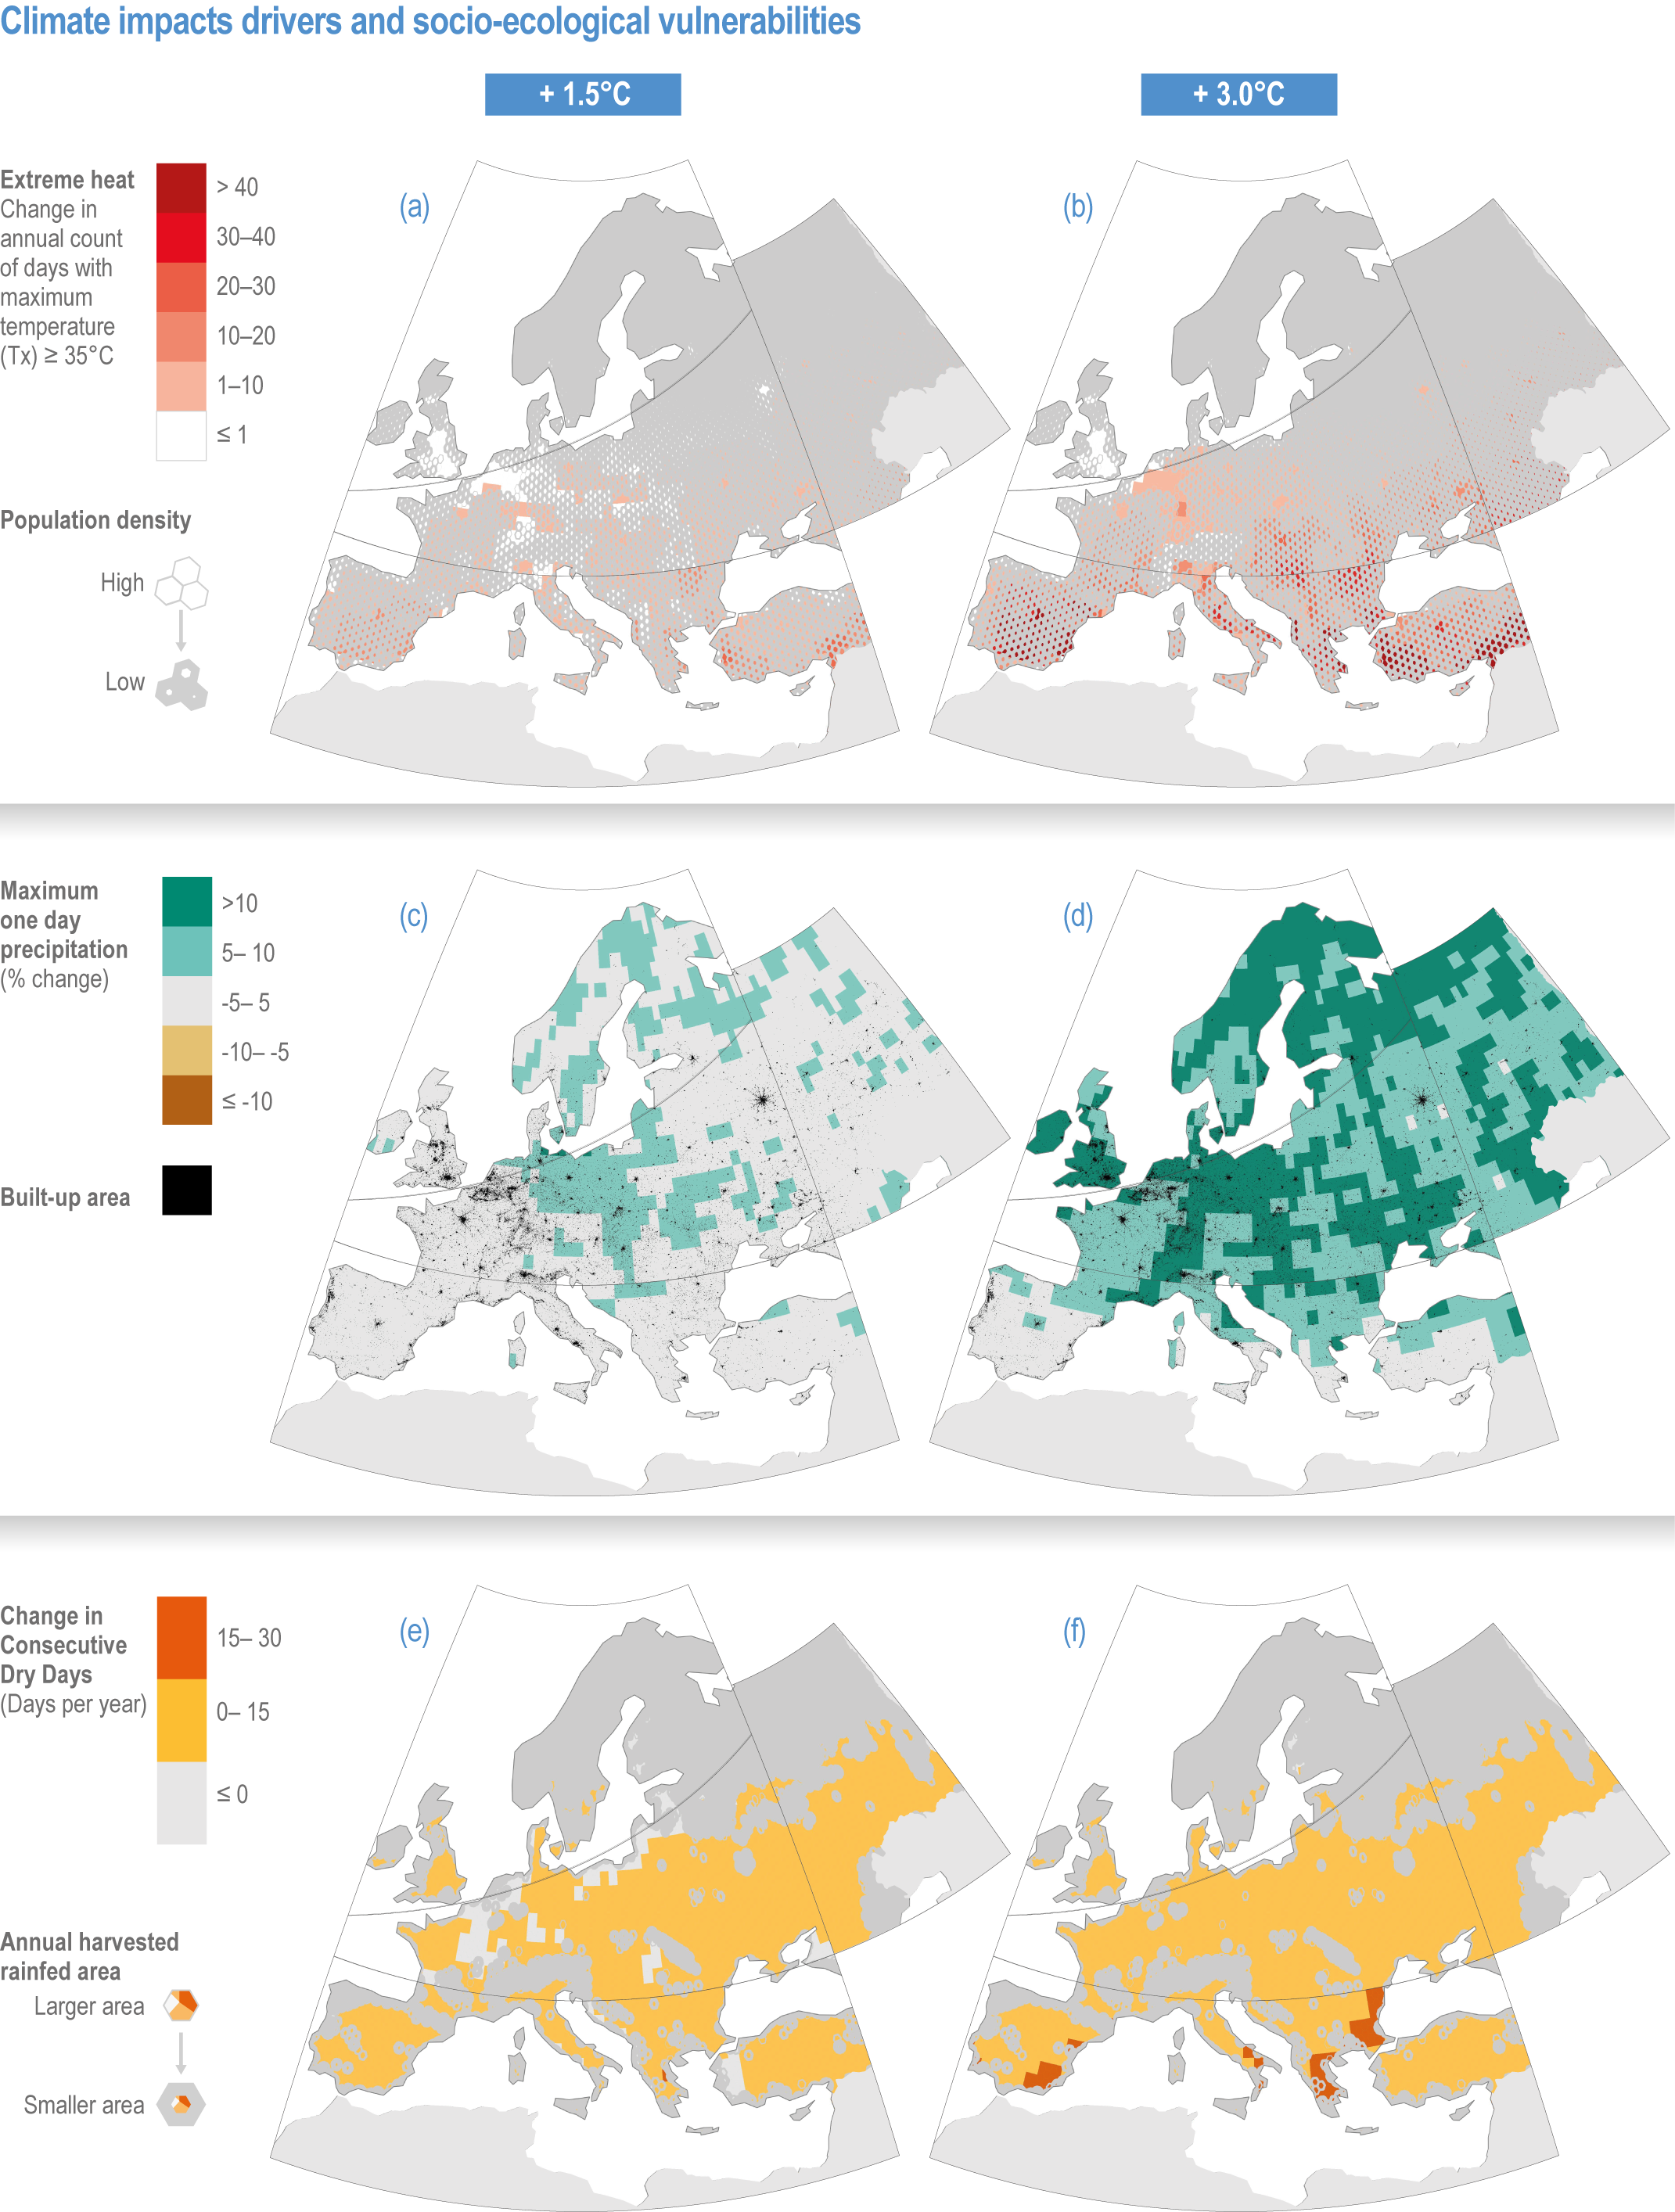
Figure caption
Figure 13.4a-f
(a,b) number of days with temperature maximum above 35°C (TX35) and population density (European Comission, 2019);
(c,d) daily precipitation maximum (R × 1 d) and built-up area (JRCdatacatalogue, 2021);
(e,f) consecutive dry days and annual harvested rain-fed area (Portmann et al., 2010);