Back chapter figures
Figure 13.4g-j
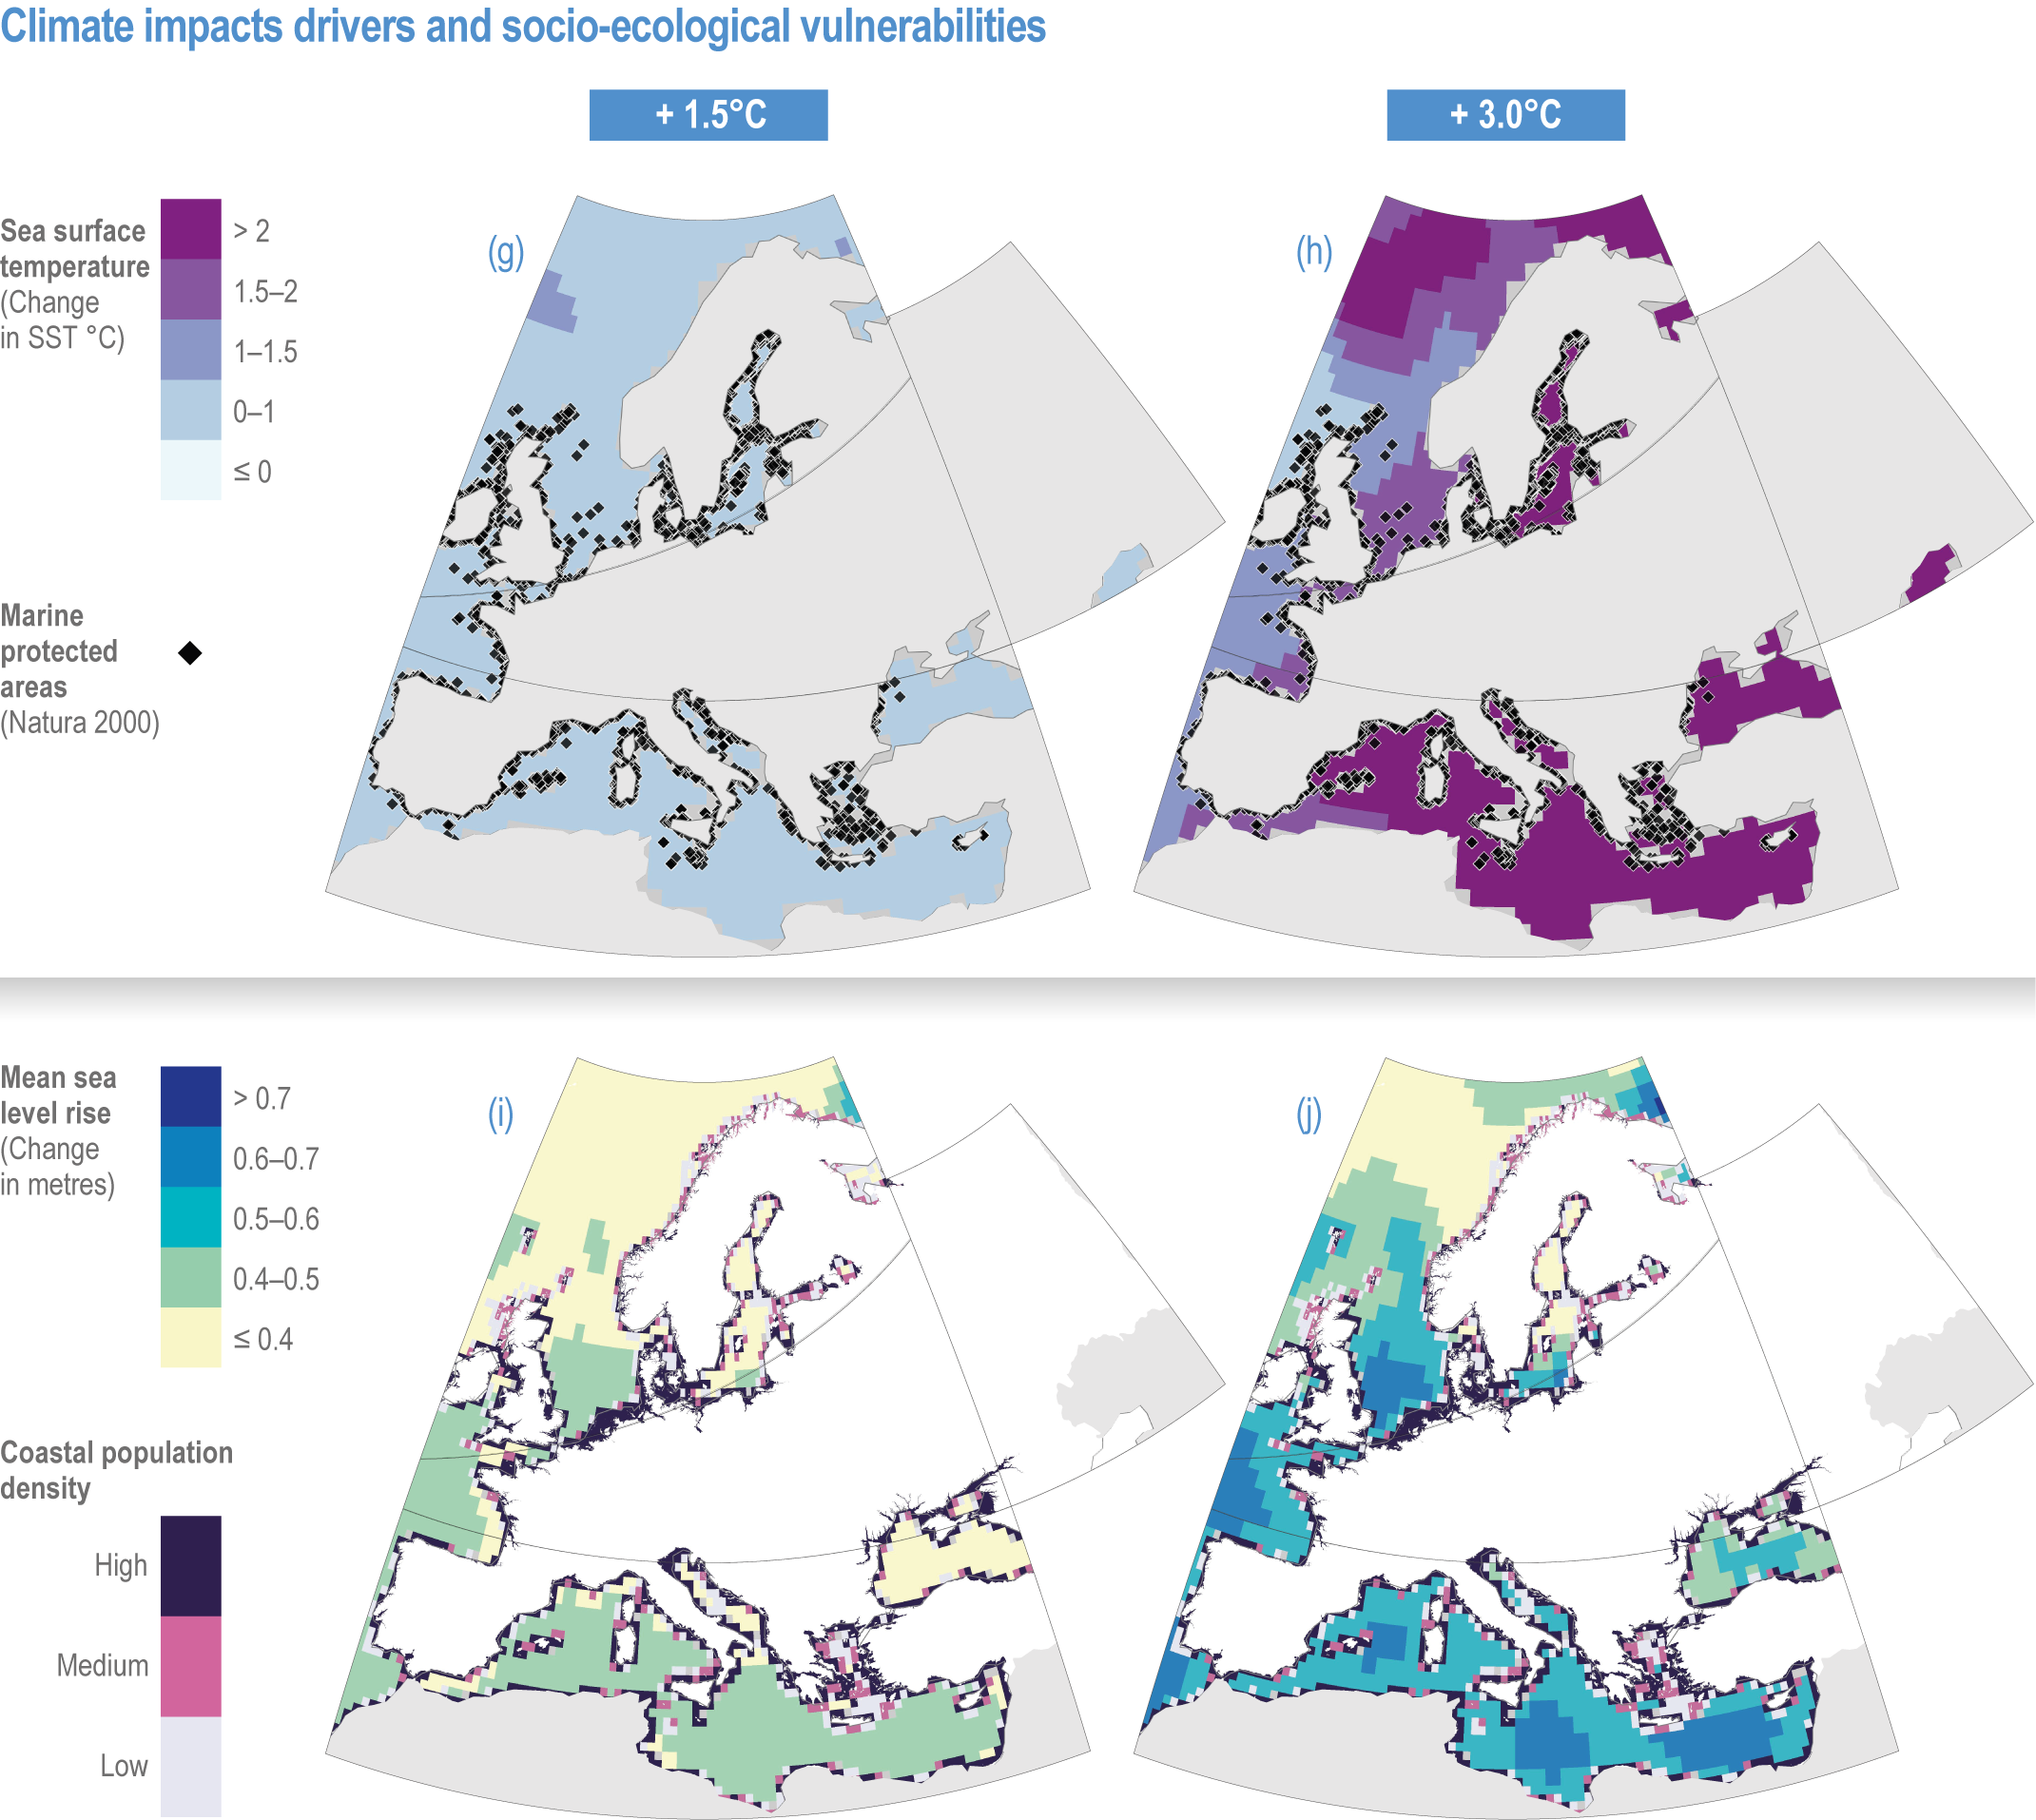
Figure caption
Figure 13.4g-j | Changes in climate hazards for global warming levels of 1. 5°C and 3°C based on the CMIP6 ensemble (Gutiérrez et al., 2021) with respect to the baseline period 1995–2014, combined with information on present exposure or vulnerability:
(g,h) sea surface temperature and marine protected areas (EEA, 2021b); and
(k,l) sea level rise (SLR) and coastal population (Merkens et al., 2016). The SLR data consider the long-term period (2081–2100) and SSP1–2.6 for (i) and SSP3–7.0 for (j).