Back chapter figures
Figure 13.32
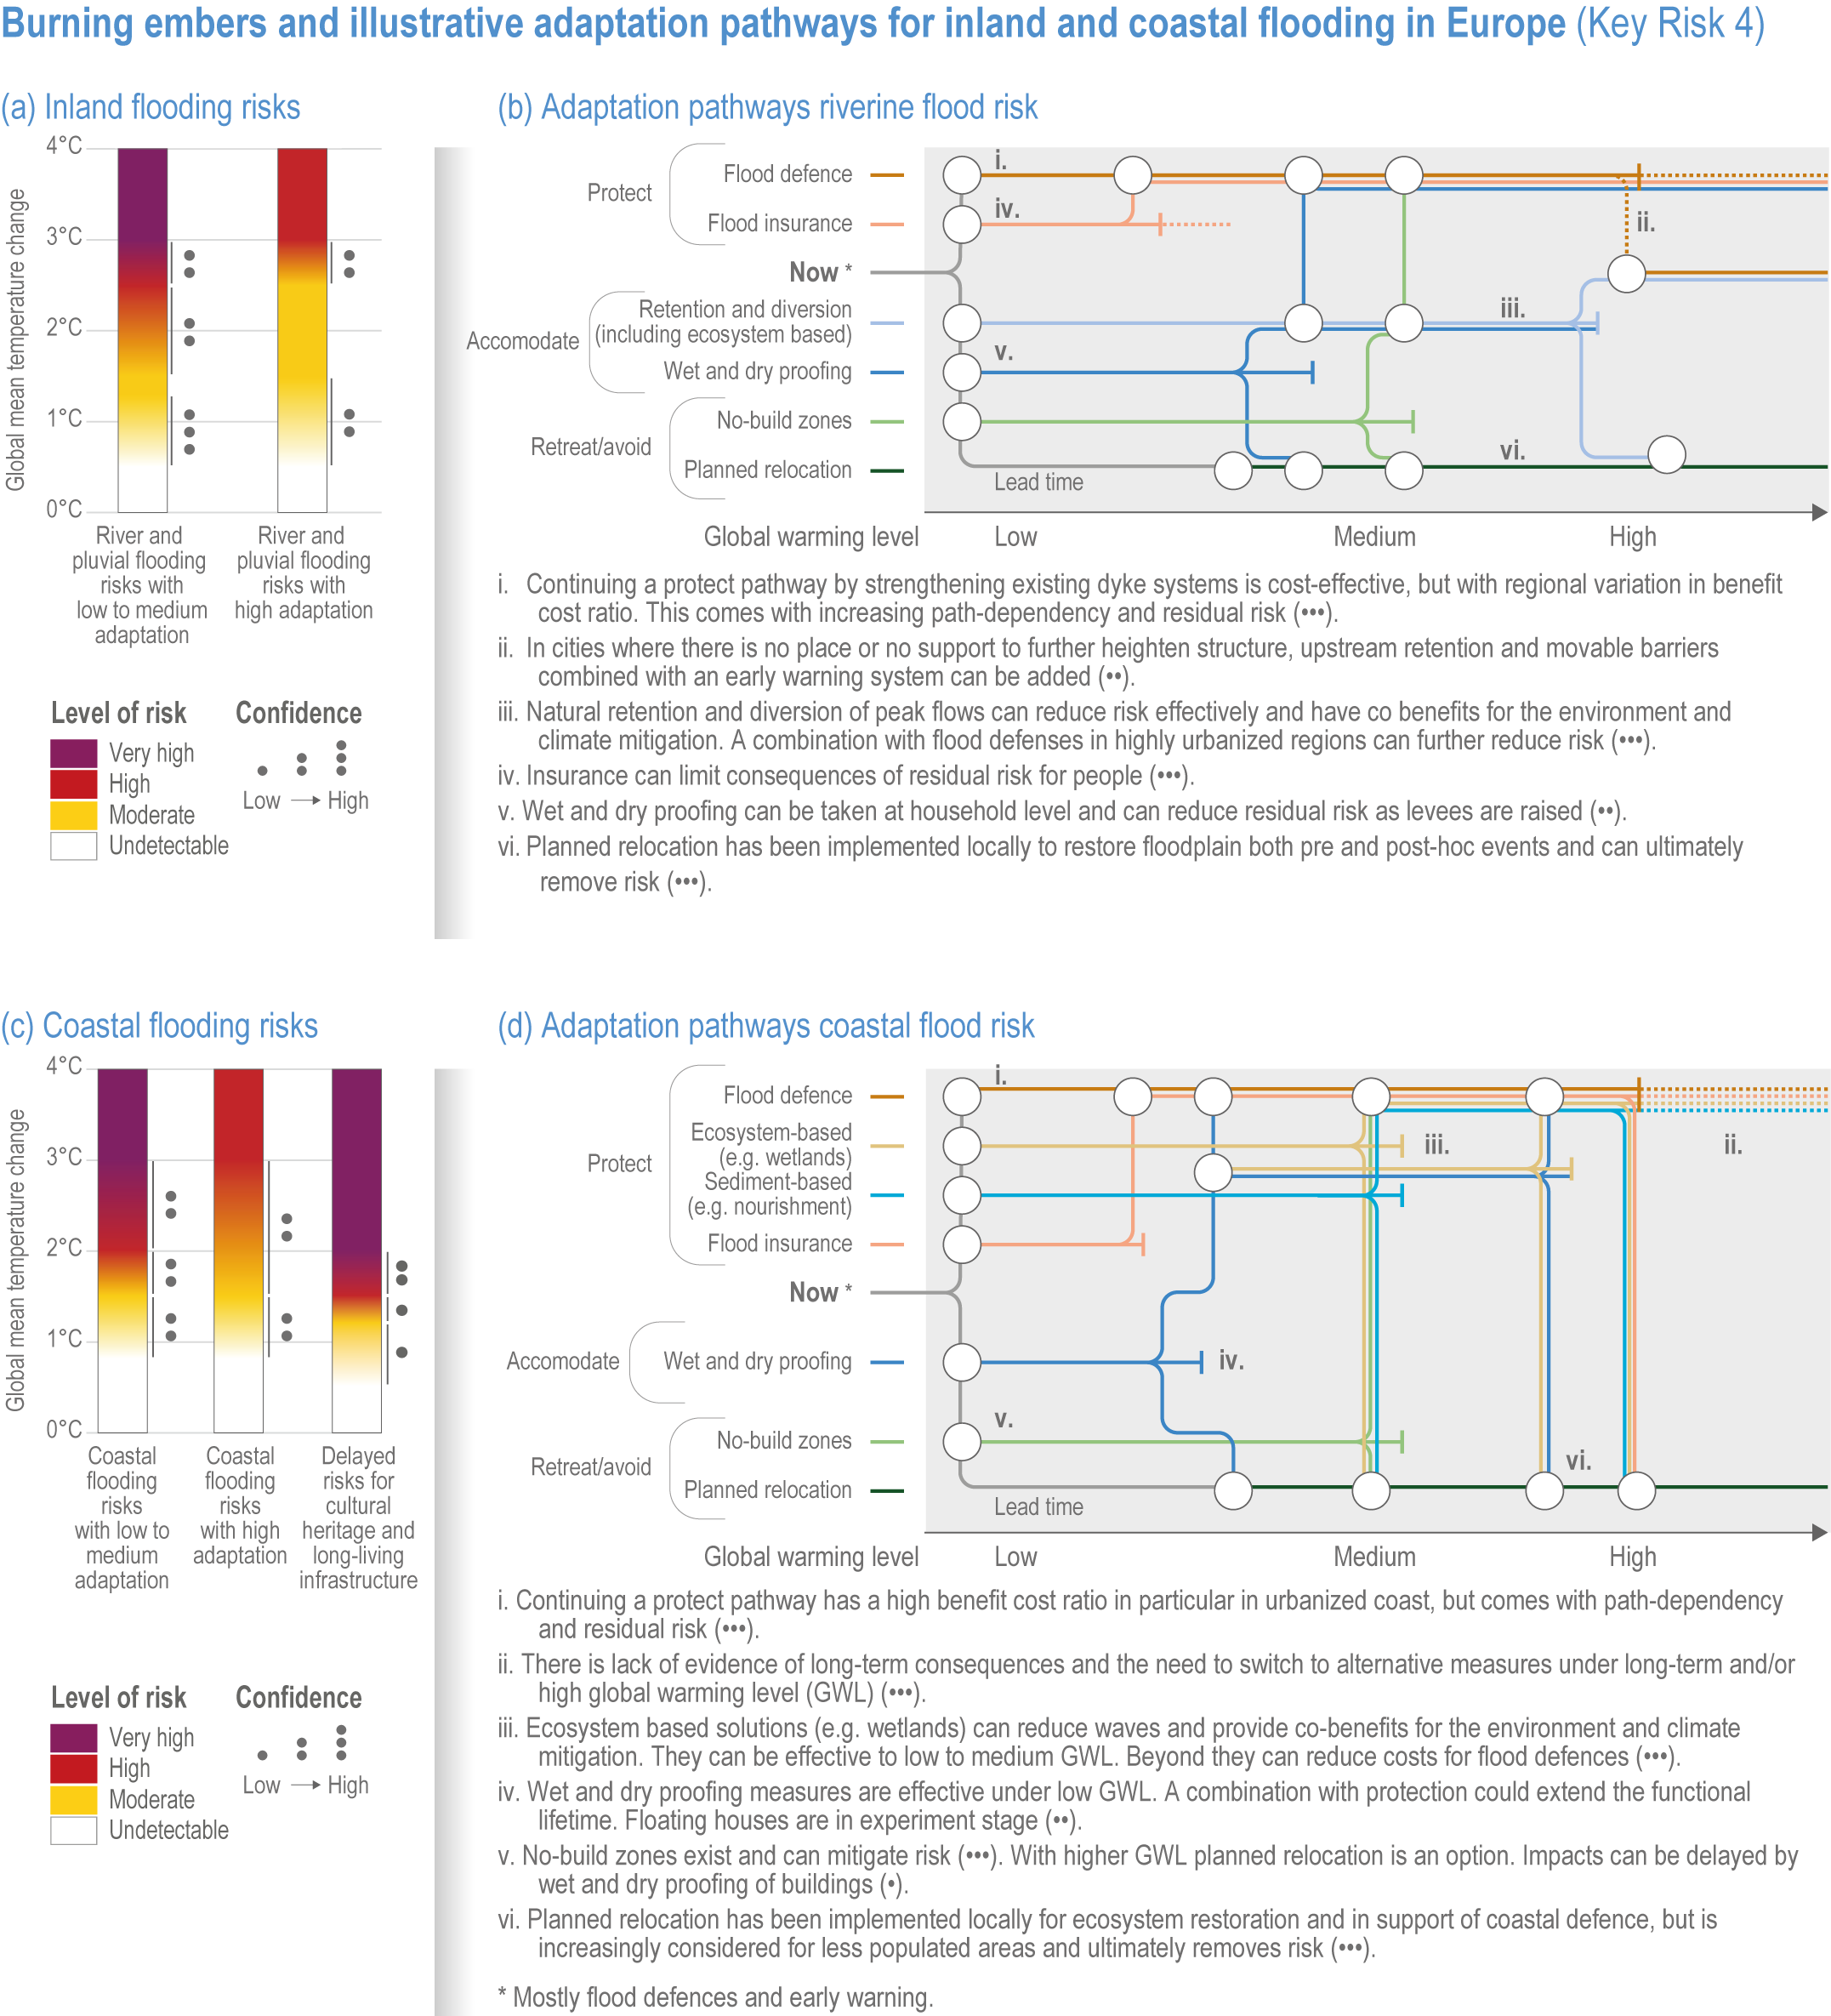
Figure caption
Figure 13.32 | Burning embers and illustrative adaptation pathways for inland and coastal flooding (Key Risk 4)
(a) Burning ember diagrams for the risks from riverine and pluvial flooding, with and without adaptation, are shown.
(b) Illustrative adaptation pathways to riverine flooding risks.
(c) Burning ember diagrams for the risks from coastal flooding, with and without adaptation, are shown.
(d) Illustrative adaptation pathways to coastal flooding risks. Grey shading means long lead time and dotted lines signal reduced effectiveness. The circles imply transfer to another measure and the bars imply that the measure has reached a tipping point (Tables SM13.30, SM13.31).