Figure Box 13.1.1
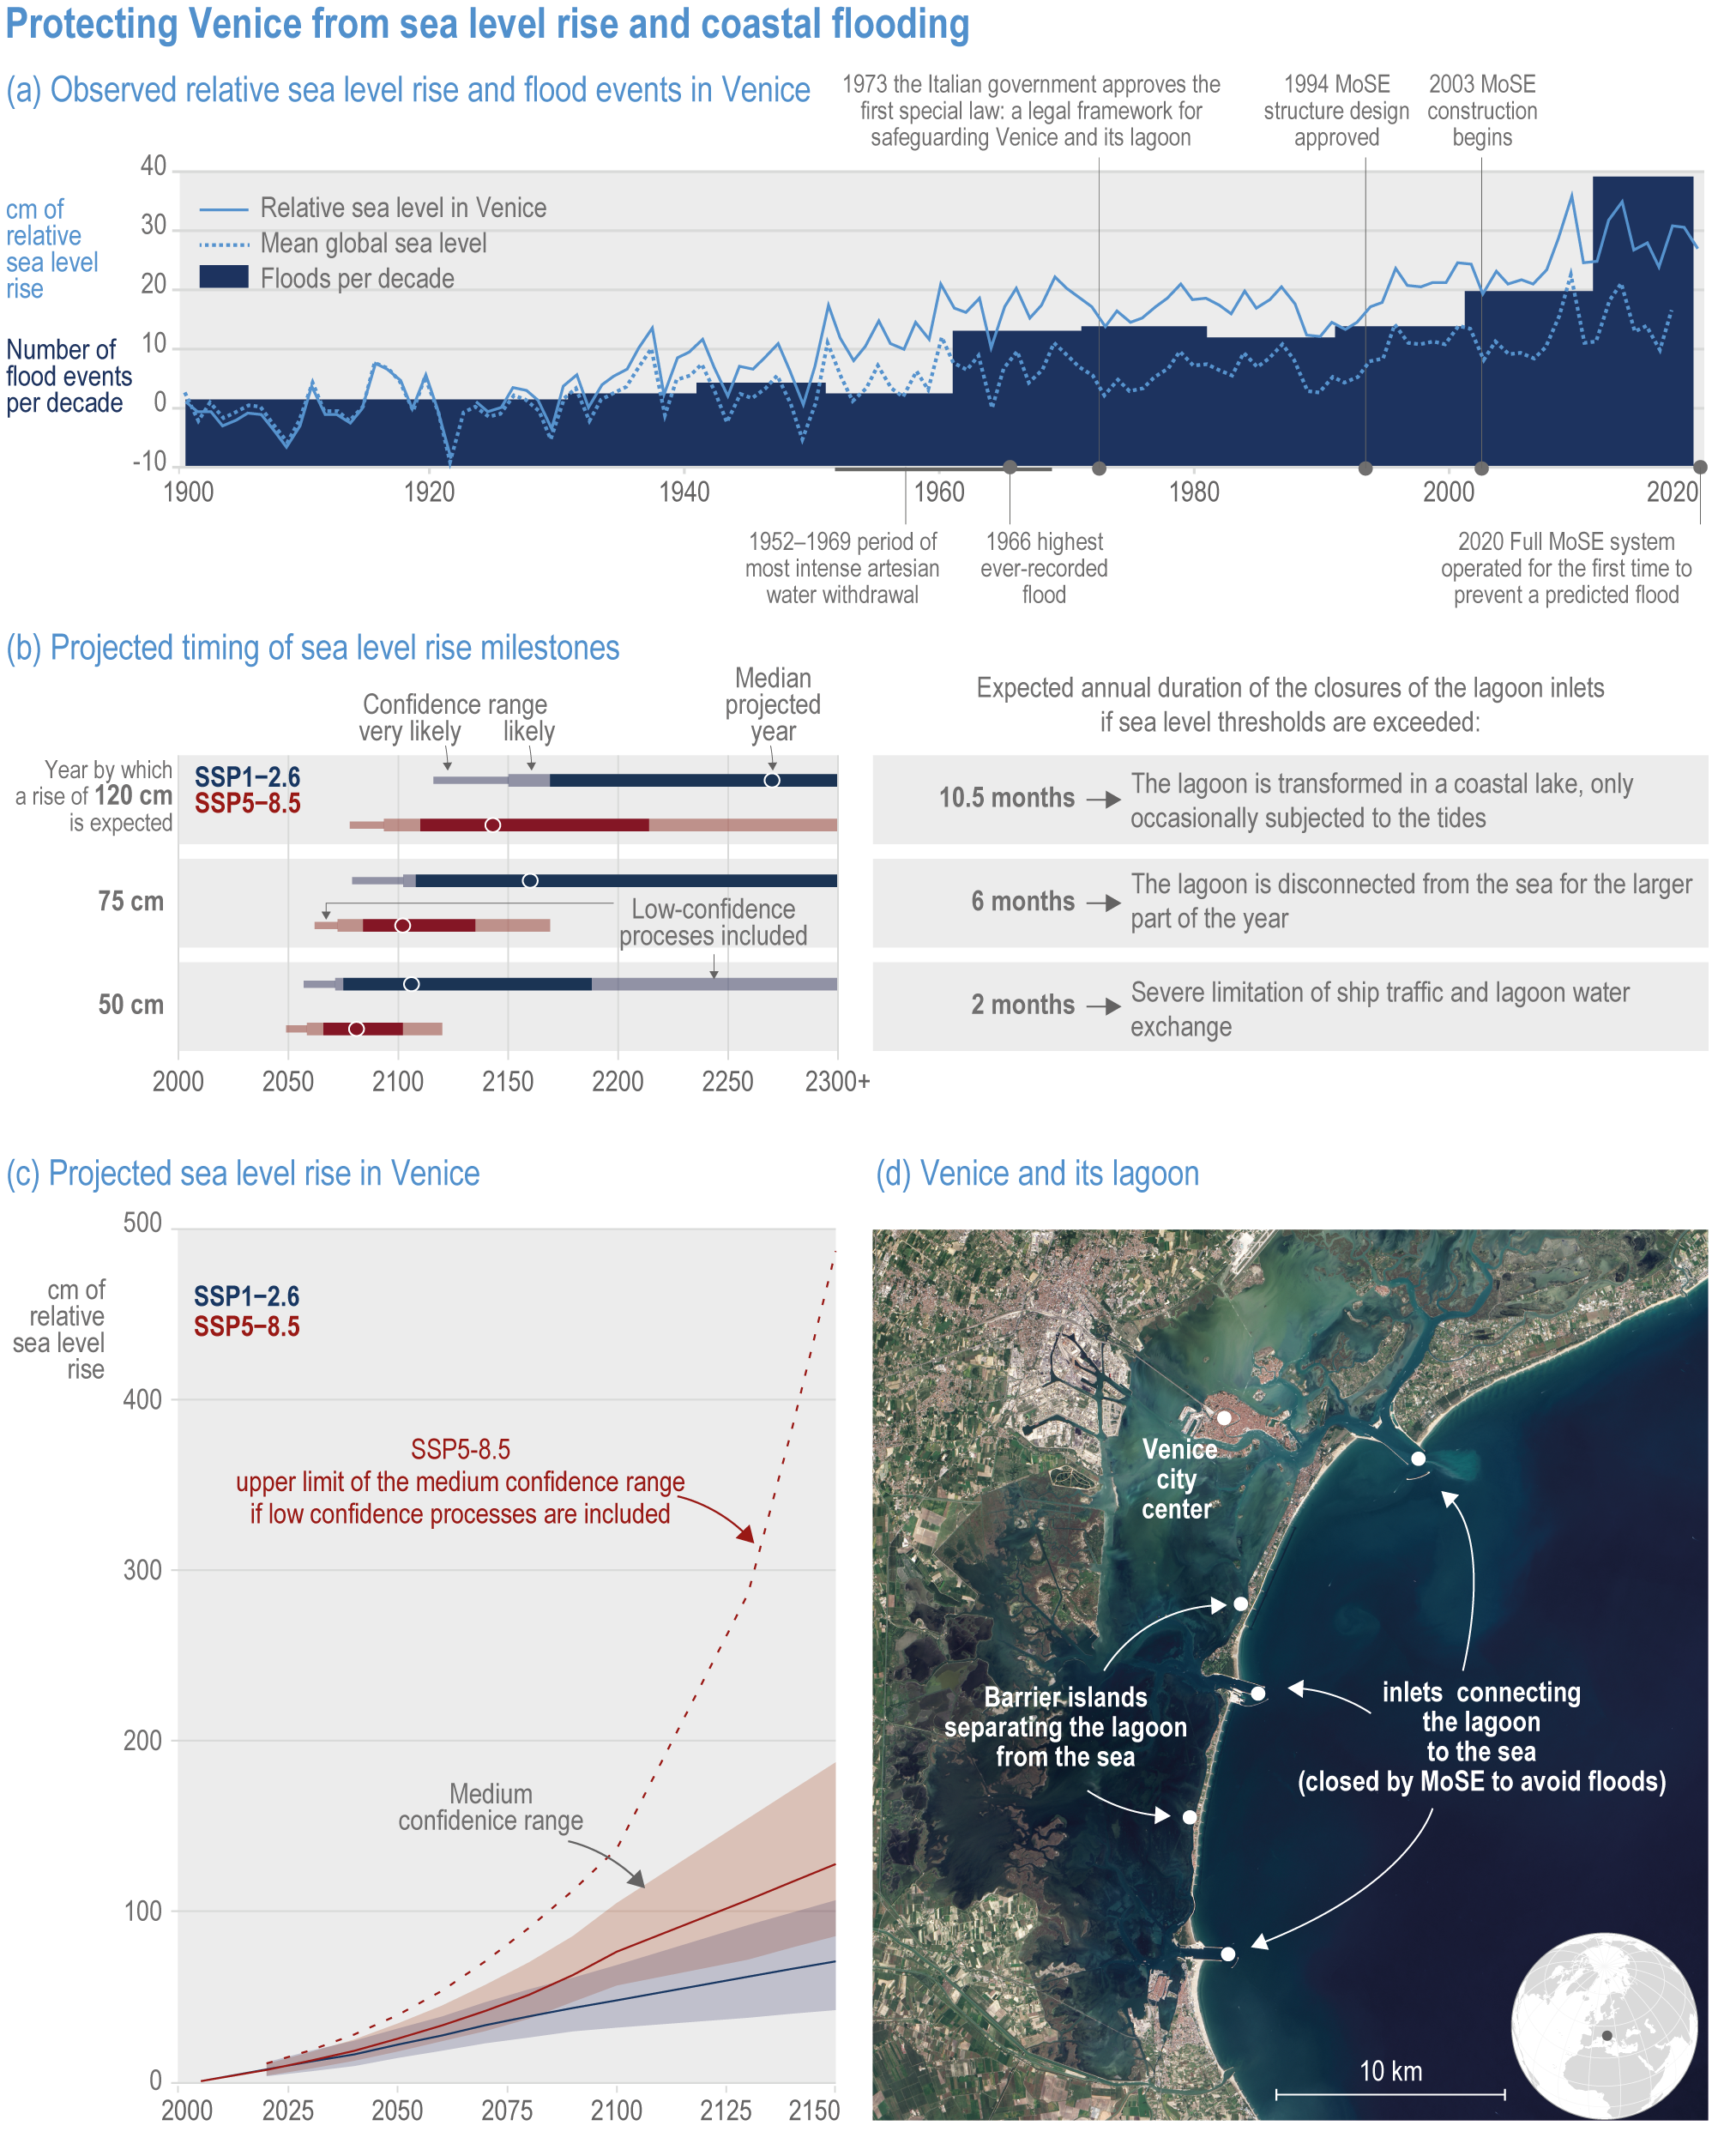
Figure caption
Figure Box 13.1.1 | Venice sea level rise (SLR) and coastal flooding: (a) evolution of relative and mean sea level in Venice and decadal frequency of floods above the safeguard level in the city centre (Frederikse et al., 2020; Lionello et al., 2021a; Lionello et al., 2021b; Zanchettin et al., 2021); (b) projected relative SLR at the Venetian coast (Fox-Kemper et al., 2021); “very likely” corresponds to 5–95th percentile range, “likely” to 17–83rd percentile range; (c) timing when critical relative sea level thresholds will be reached depending on scenarios and confidence level (Lionello, 2012; Umgiesser, 2020; Lionello et al., 2021a), the upper limit of the medium confidence range under SSP5–8.5 represents a low-likelihood, high-impact storyline, low confidence processes include ice sheet instability; (d) Landsat view of Venice and its lagoon with the three inlets connecting it to the Adriatic Sea.