Figure 14.2
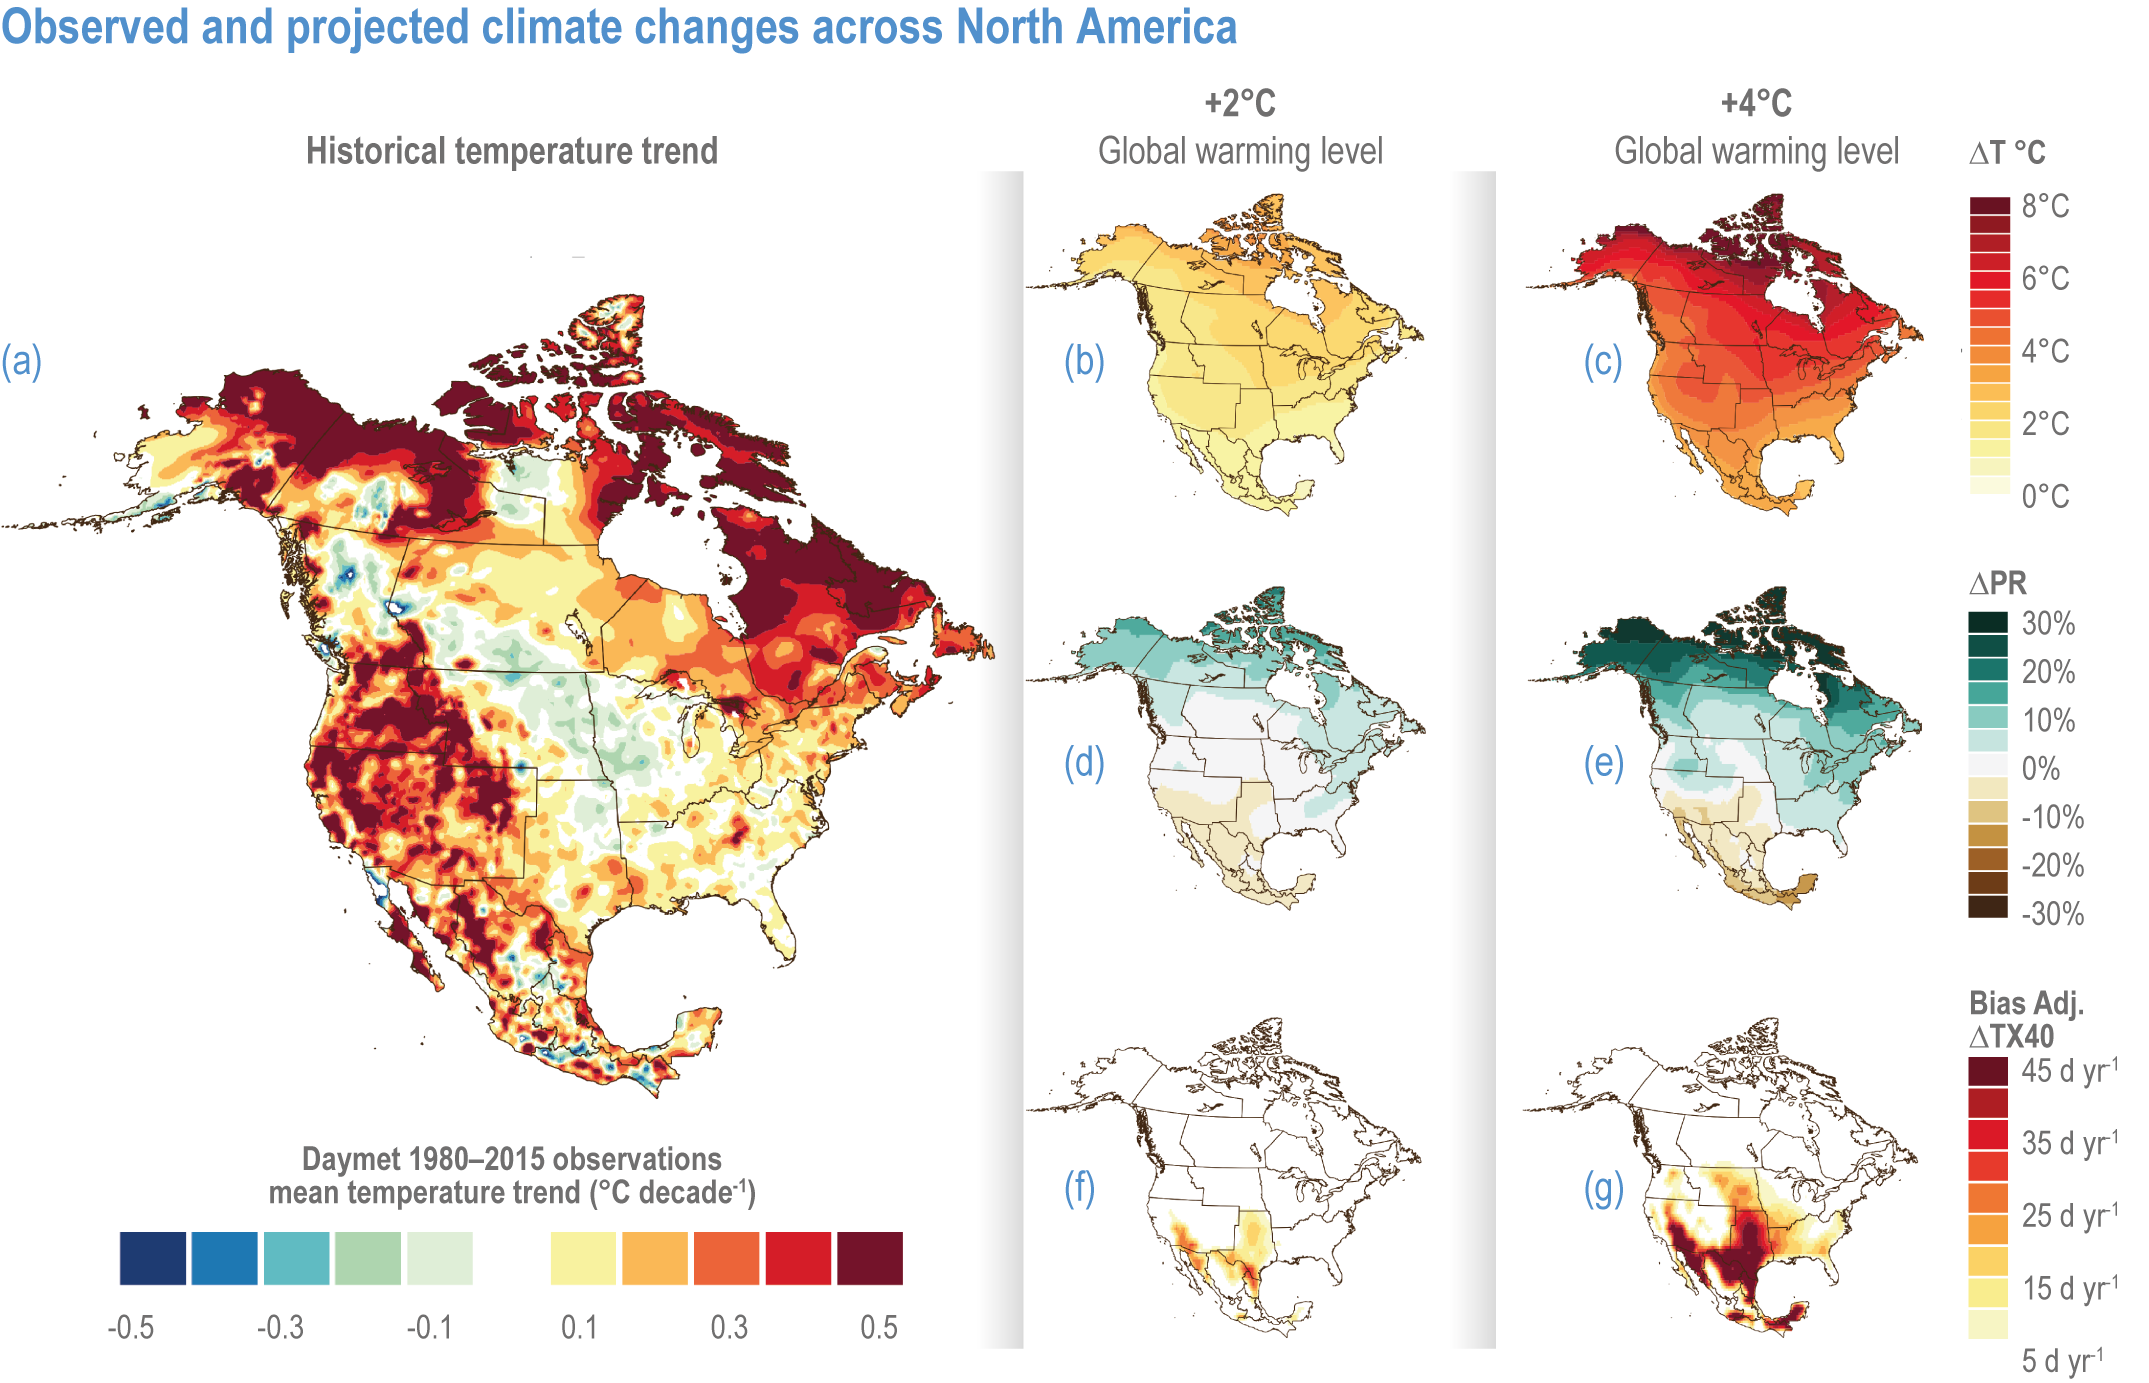
Figure caption
Figure 14.2 | Observed and projected climate changes across North America. Black boundary lines delineate North American sub-regions (Figure 14.1). Data were extracted from Gutiérrezet al. 2021a viahttp://interactive-atlas.ipcc.ch/ (WGI Interactive Atlas) (Gutiérrez et al., 2021b), where dataset details can be found. (A) Recent observations; (B) to (G) are from an ensemble of CMIP6 projections.
(A) Observed annual mean temperature trend over land for 1980–2015.
(B,C) Projected change in annual mean temperature over land relative to the 1986–2005 average, associated with 2°C or 4°C global warming.
(D,E) Like (B,C) but for projected percentage change in annual precipitation.
(F,G) Like (B,C) but for projected change in number of days per year with maximum temperature >40°C (‘TX40’).