Figure 16.1
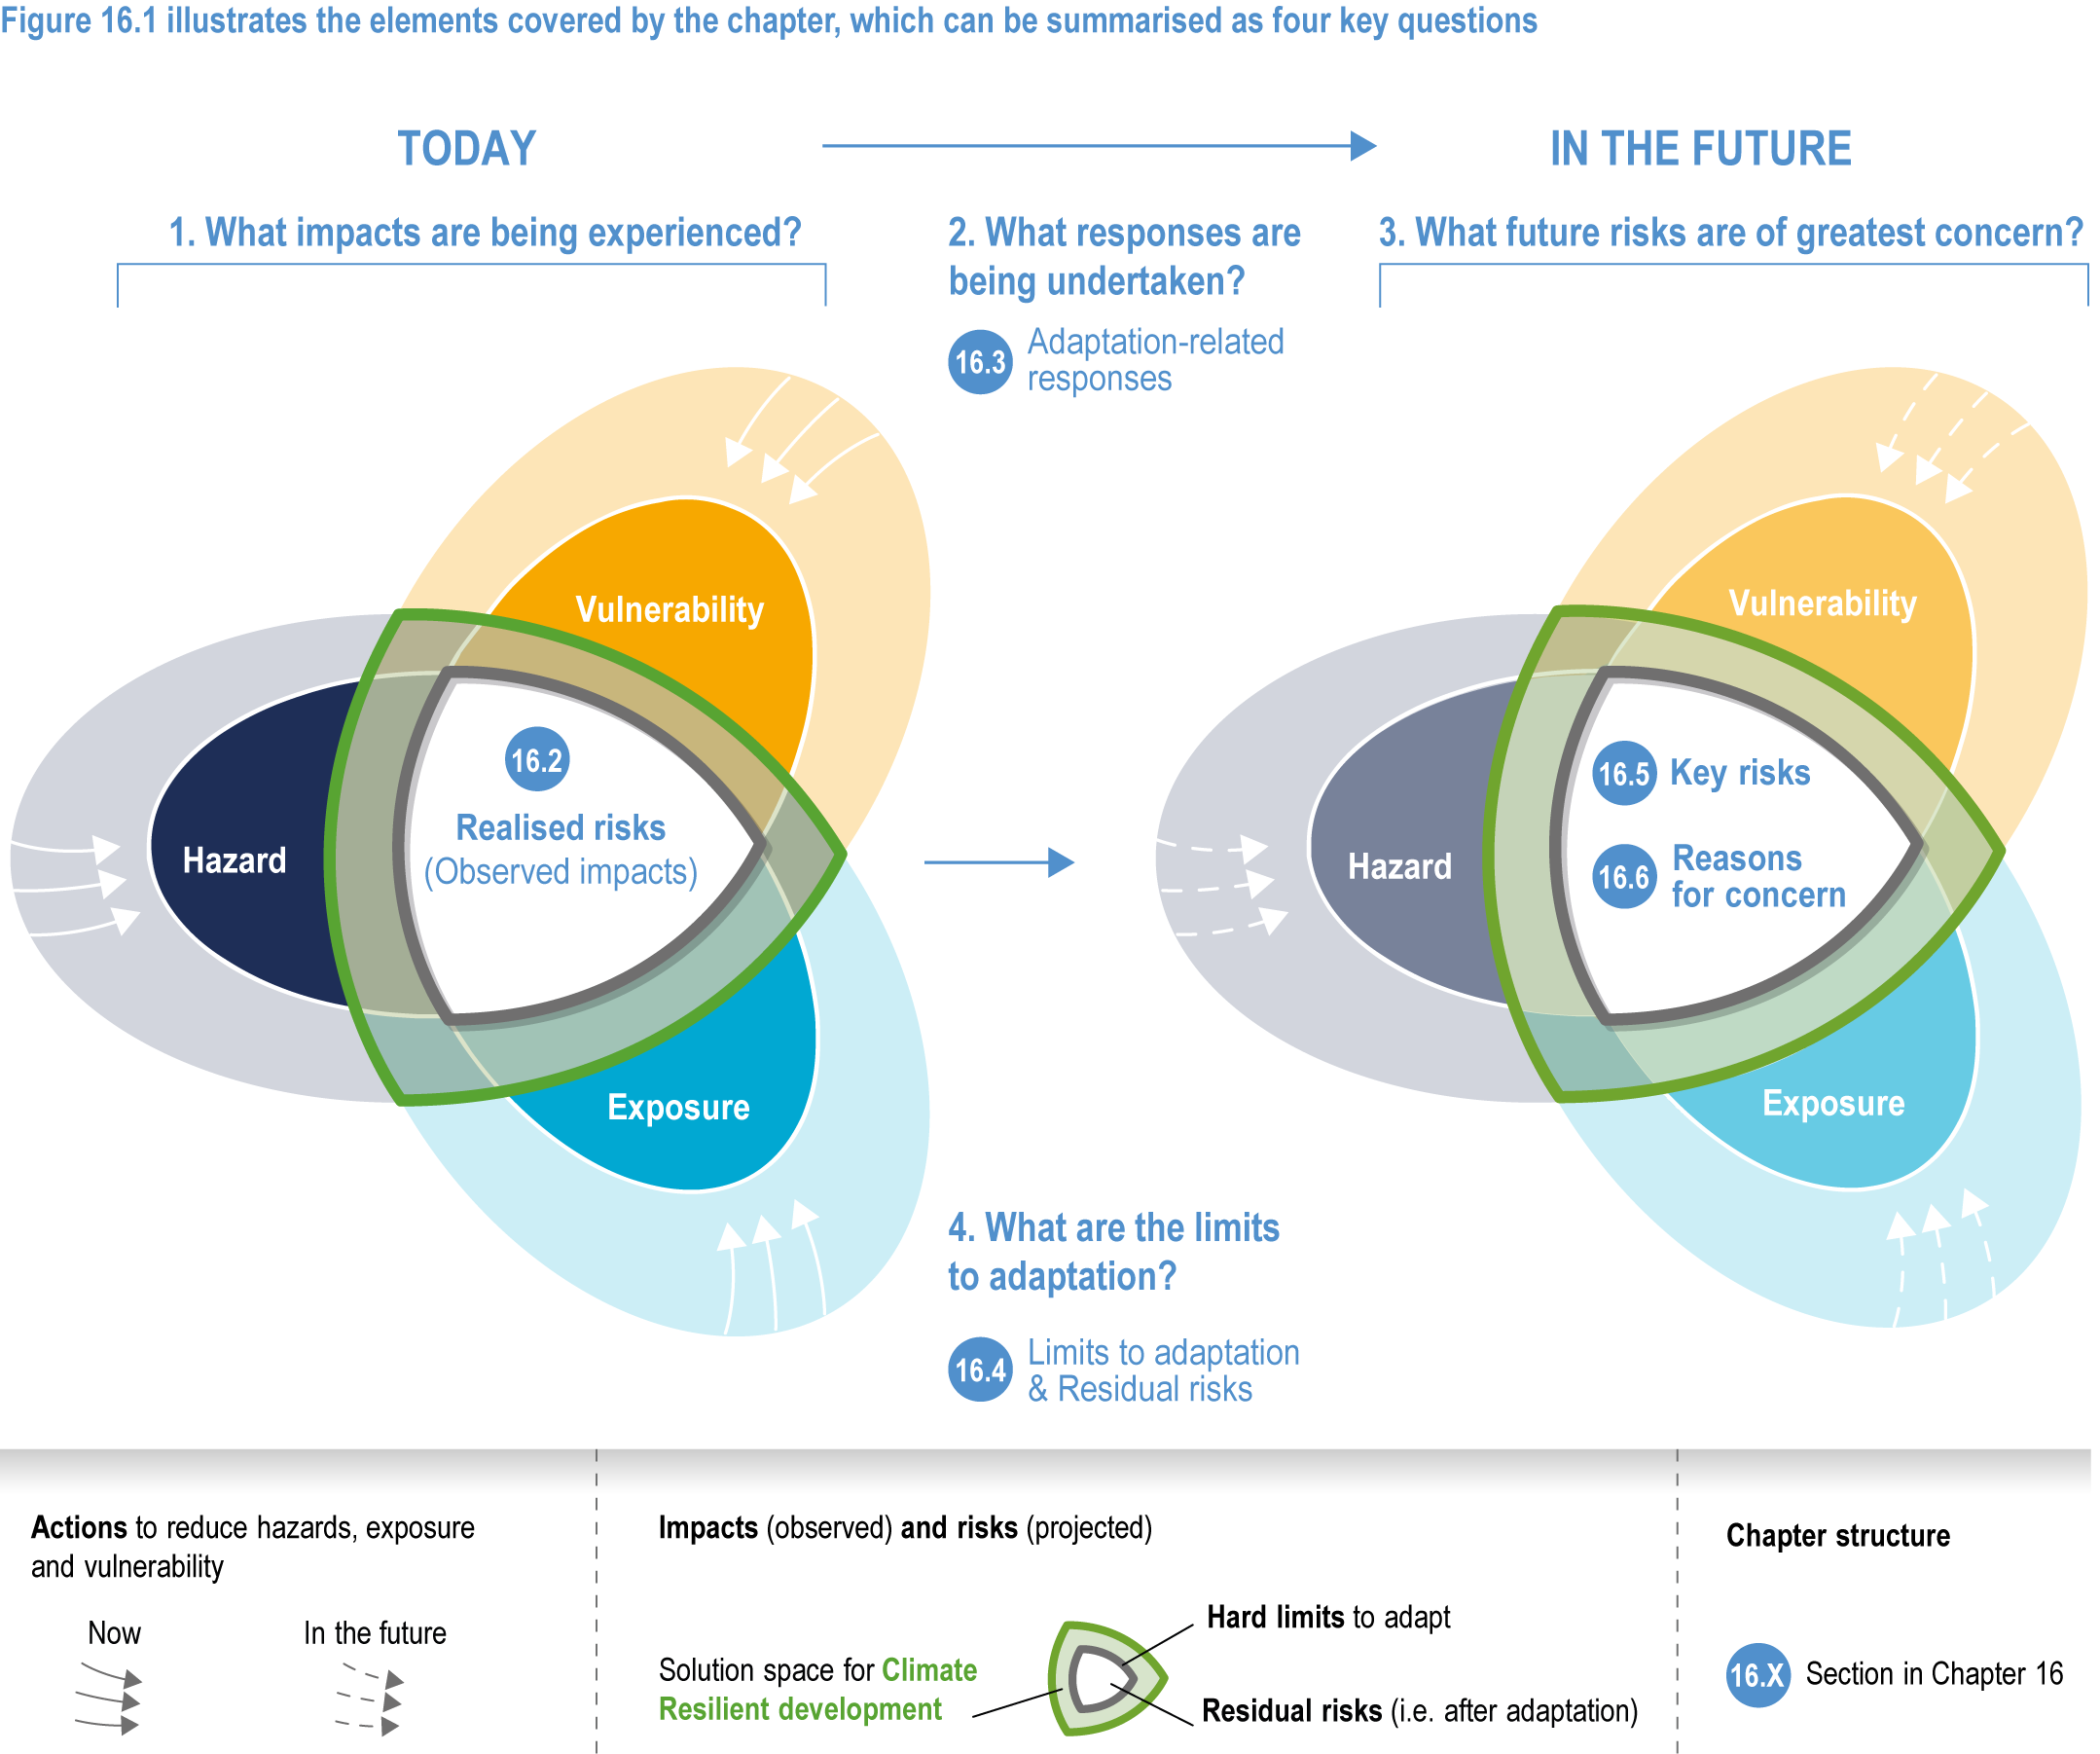
Figure caption
Figure 16.1 | Illustrative storyline of the chapter highlighting the central questions addressed in the various sections, from realised risks (observed impacts) to future risks (key risks and reasons for concern), informed by adaptation-related responses and the limits to adaptation. The arrows illustrate actions to reduce hazard, exposure and vulnerability, which shape risks over time. Accordingly, the green areas at the centre of the propeller diagrams indicate the ability for such solutions to reduce risk, up to certain adaptation limits, leaving the white residual risk (or observed impacts) in the centre. The shading of the right-hand-side propeller diagram compared with the non-shaded one on the left reflects some degree of uncertainty about future risks. The figure builds on the conceptual framework of risk–adaptation relationships used in SROCC (Garschagen et al., 2019).