Figure Cross-Working Group Box ECONOMIC.1
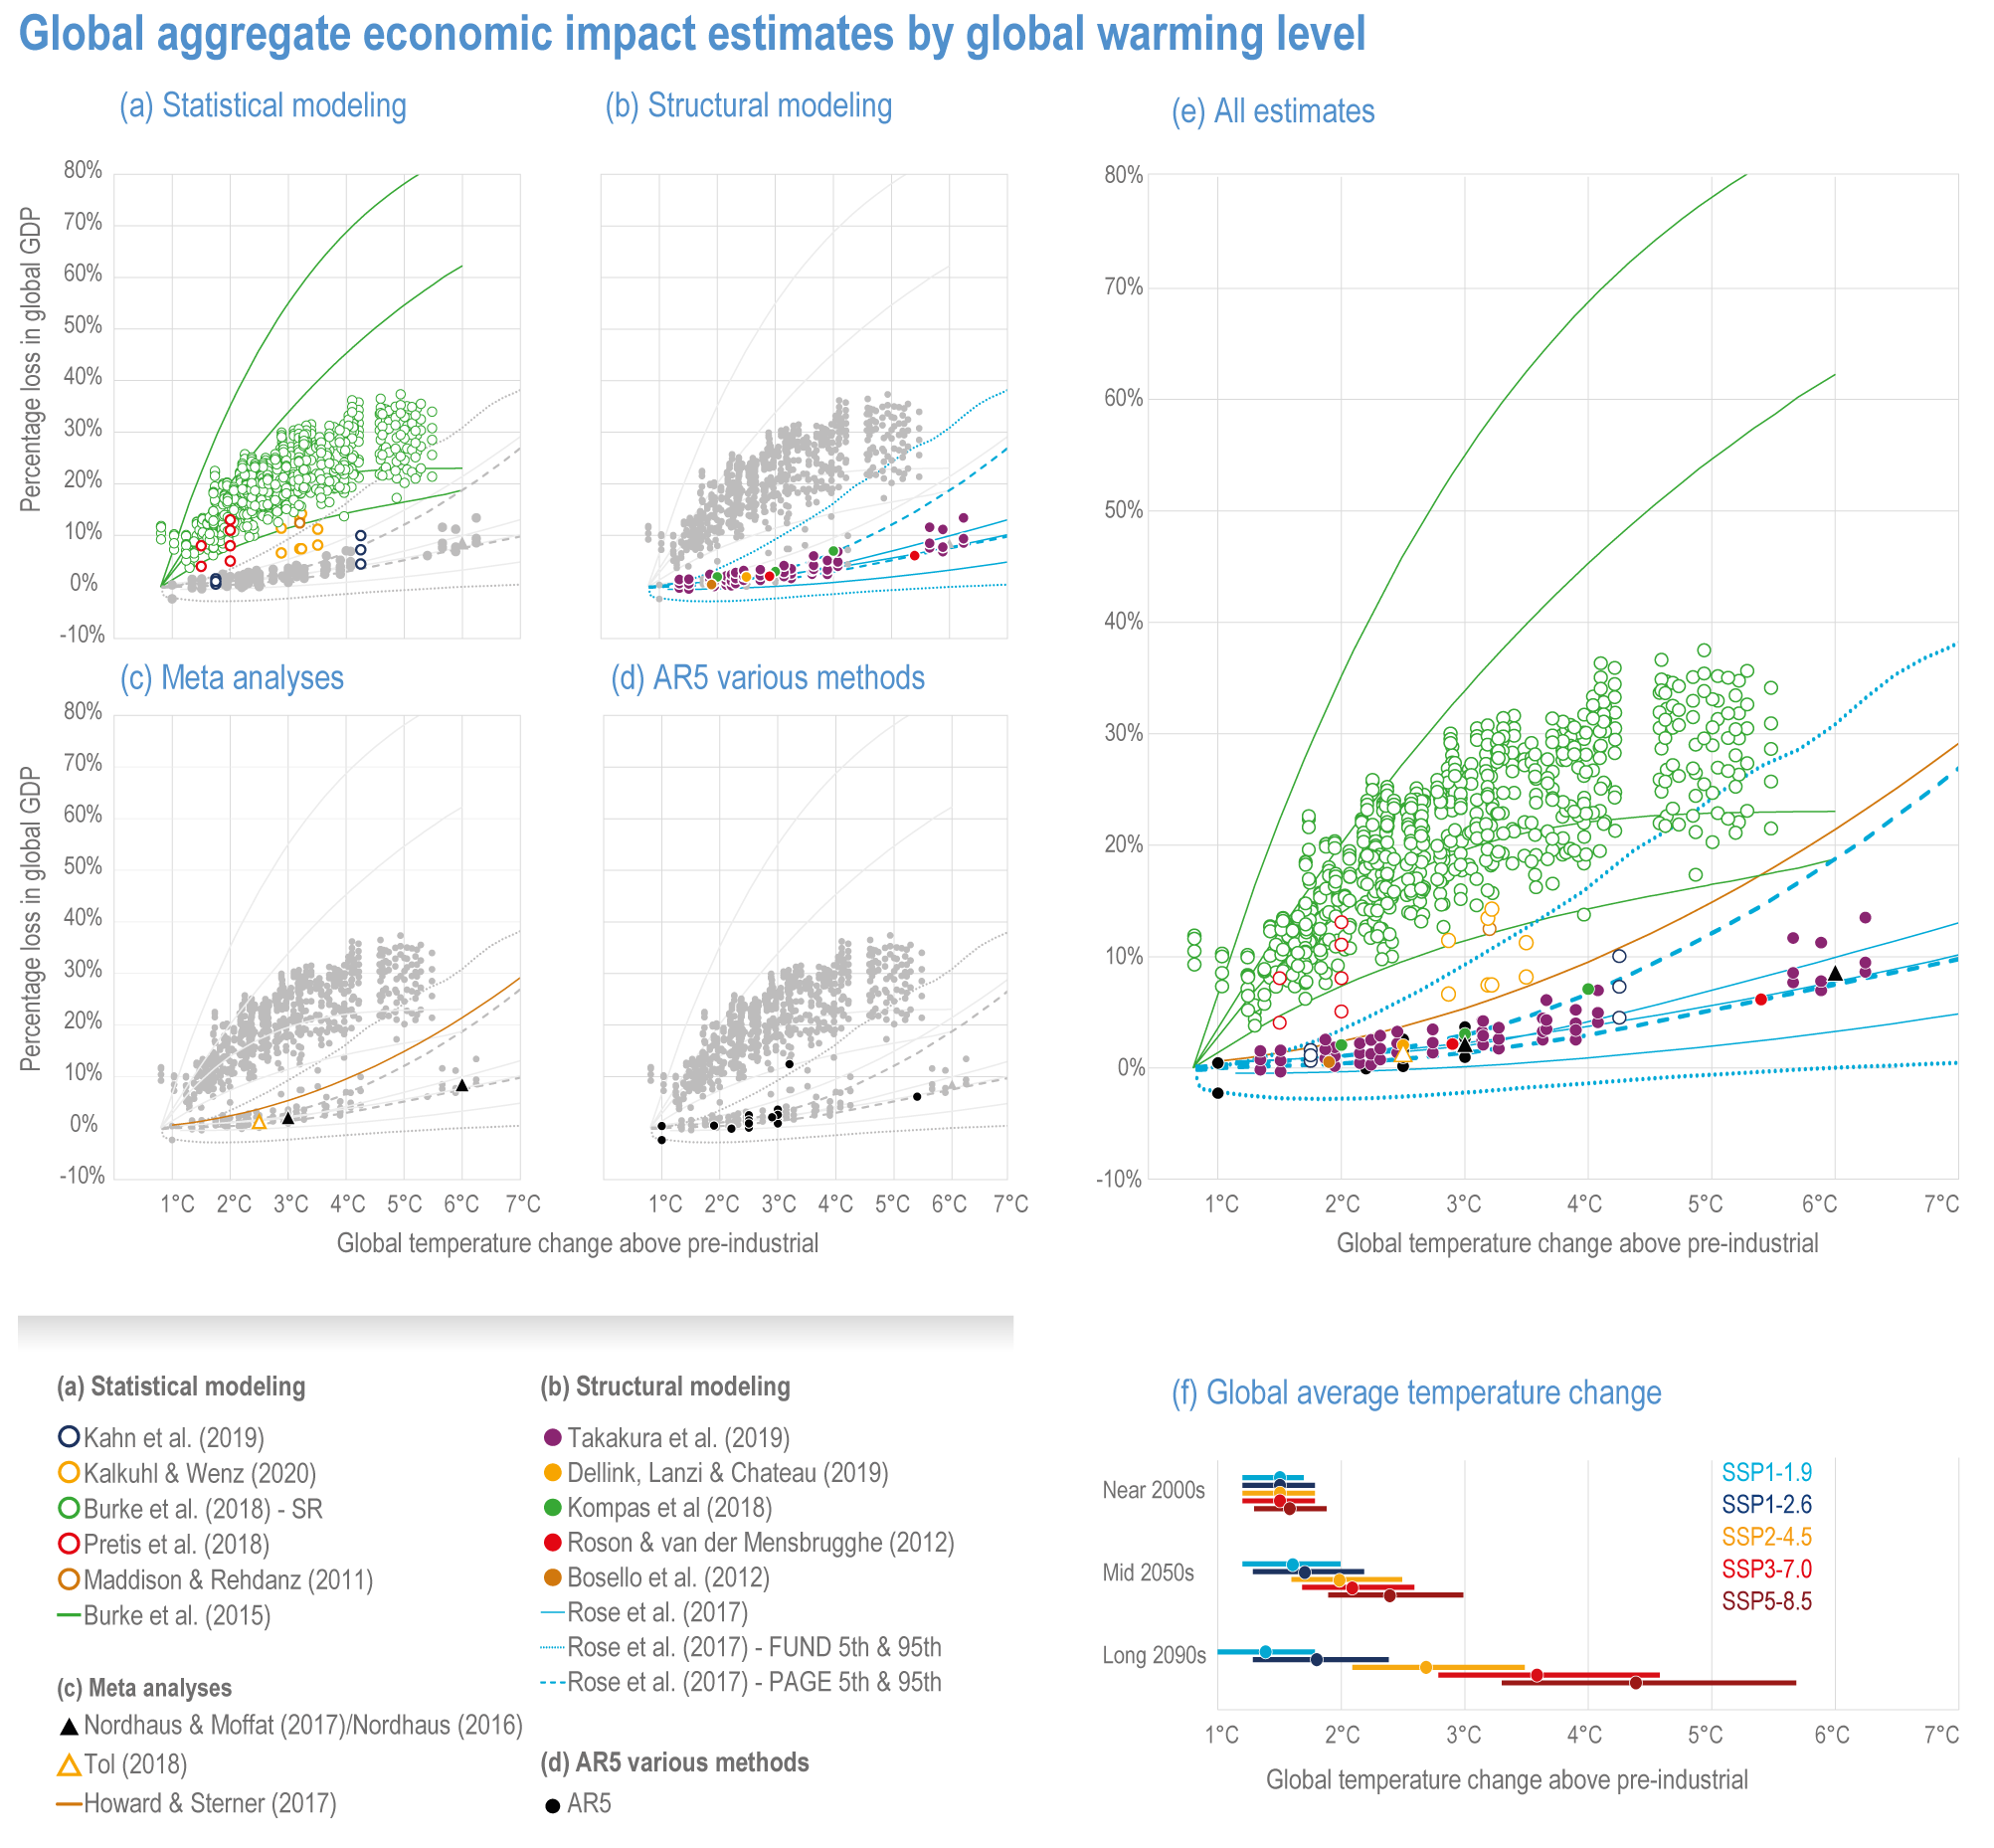
Figure caption
Figure Cross-Working Group Box ECONOMIC.1 | Global aggregate economic impact estimates by global warming level (annual % global GDP loss relative to GDP without additional climate change). Top row panels present estimates by methodology type: (a) statistical modelling, (b) structural modelling and (c) meta-analyses, with all estimates from a paper in the same colour and estimates from methodologies other than that highlighted by the panel in grey for reference. Second row left panel (d) presents AR5 estimates. Second row right panel (e) presents all estimates in one figure, with the same colours as panels (a–d) using outlined dots for the statistical modelling estimates, solid dots for structural modelling estimates, and triangles for meta-analysis estimates. In all panels, lines represent functions, with dashed and dotted lines 5th and 95th percentile functions from structural modelling. To avoid duplication, estimates from papers using the economic impacts estimates or model formulations already represented in the figure are not included (e.g., Diaz and Moore, 2017; Chen et al., 2020b; Glanemann et al., 2020; Warren et al., 2021). The exception is Burke et al. (2018), with the different estimates shown representing variation across climate scenarios for a given aggregate economic impacts specification from Burke et al. (2015)—the ‘pooled, short run’ statistical specification. Results shown for the latter are estimates with the author’s different statistical model specifications (and a fixed climate scenario, SSP5). From top to bottom, the Burke et al. (2015) estimates are for the ‘pooled, long run’, ‘differentiated, long run’, ‘pooled, short run’ (authors’ base case) and ‘differentiated, short run’ statistical specifications. For Howard and Sterner (2017), the authors’ preferred function is shown. Overall, estimates shown in the figure can correspond to different future years, reflecting different socioeconomic conditions and climate pathways to a global warming level. Global average temperature change bars relative to the period 1850–1900 are shown below the economic cost estimates to provide context to potential future warming. Shown are the WGI AR6 assessed best estimates and 90% intervals for the illustrative emissions scenarios considered for the near term 2021–2040, mid-term 2041–2060 and long term 2081–2100.