Back chapter figures
Figure 17.6
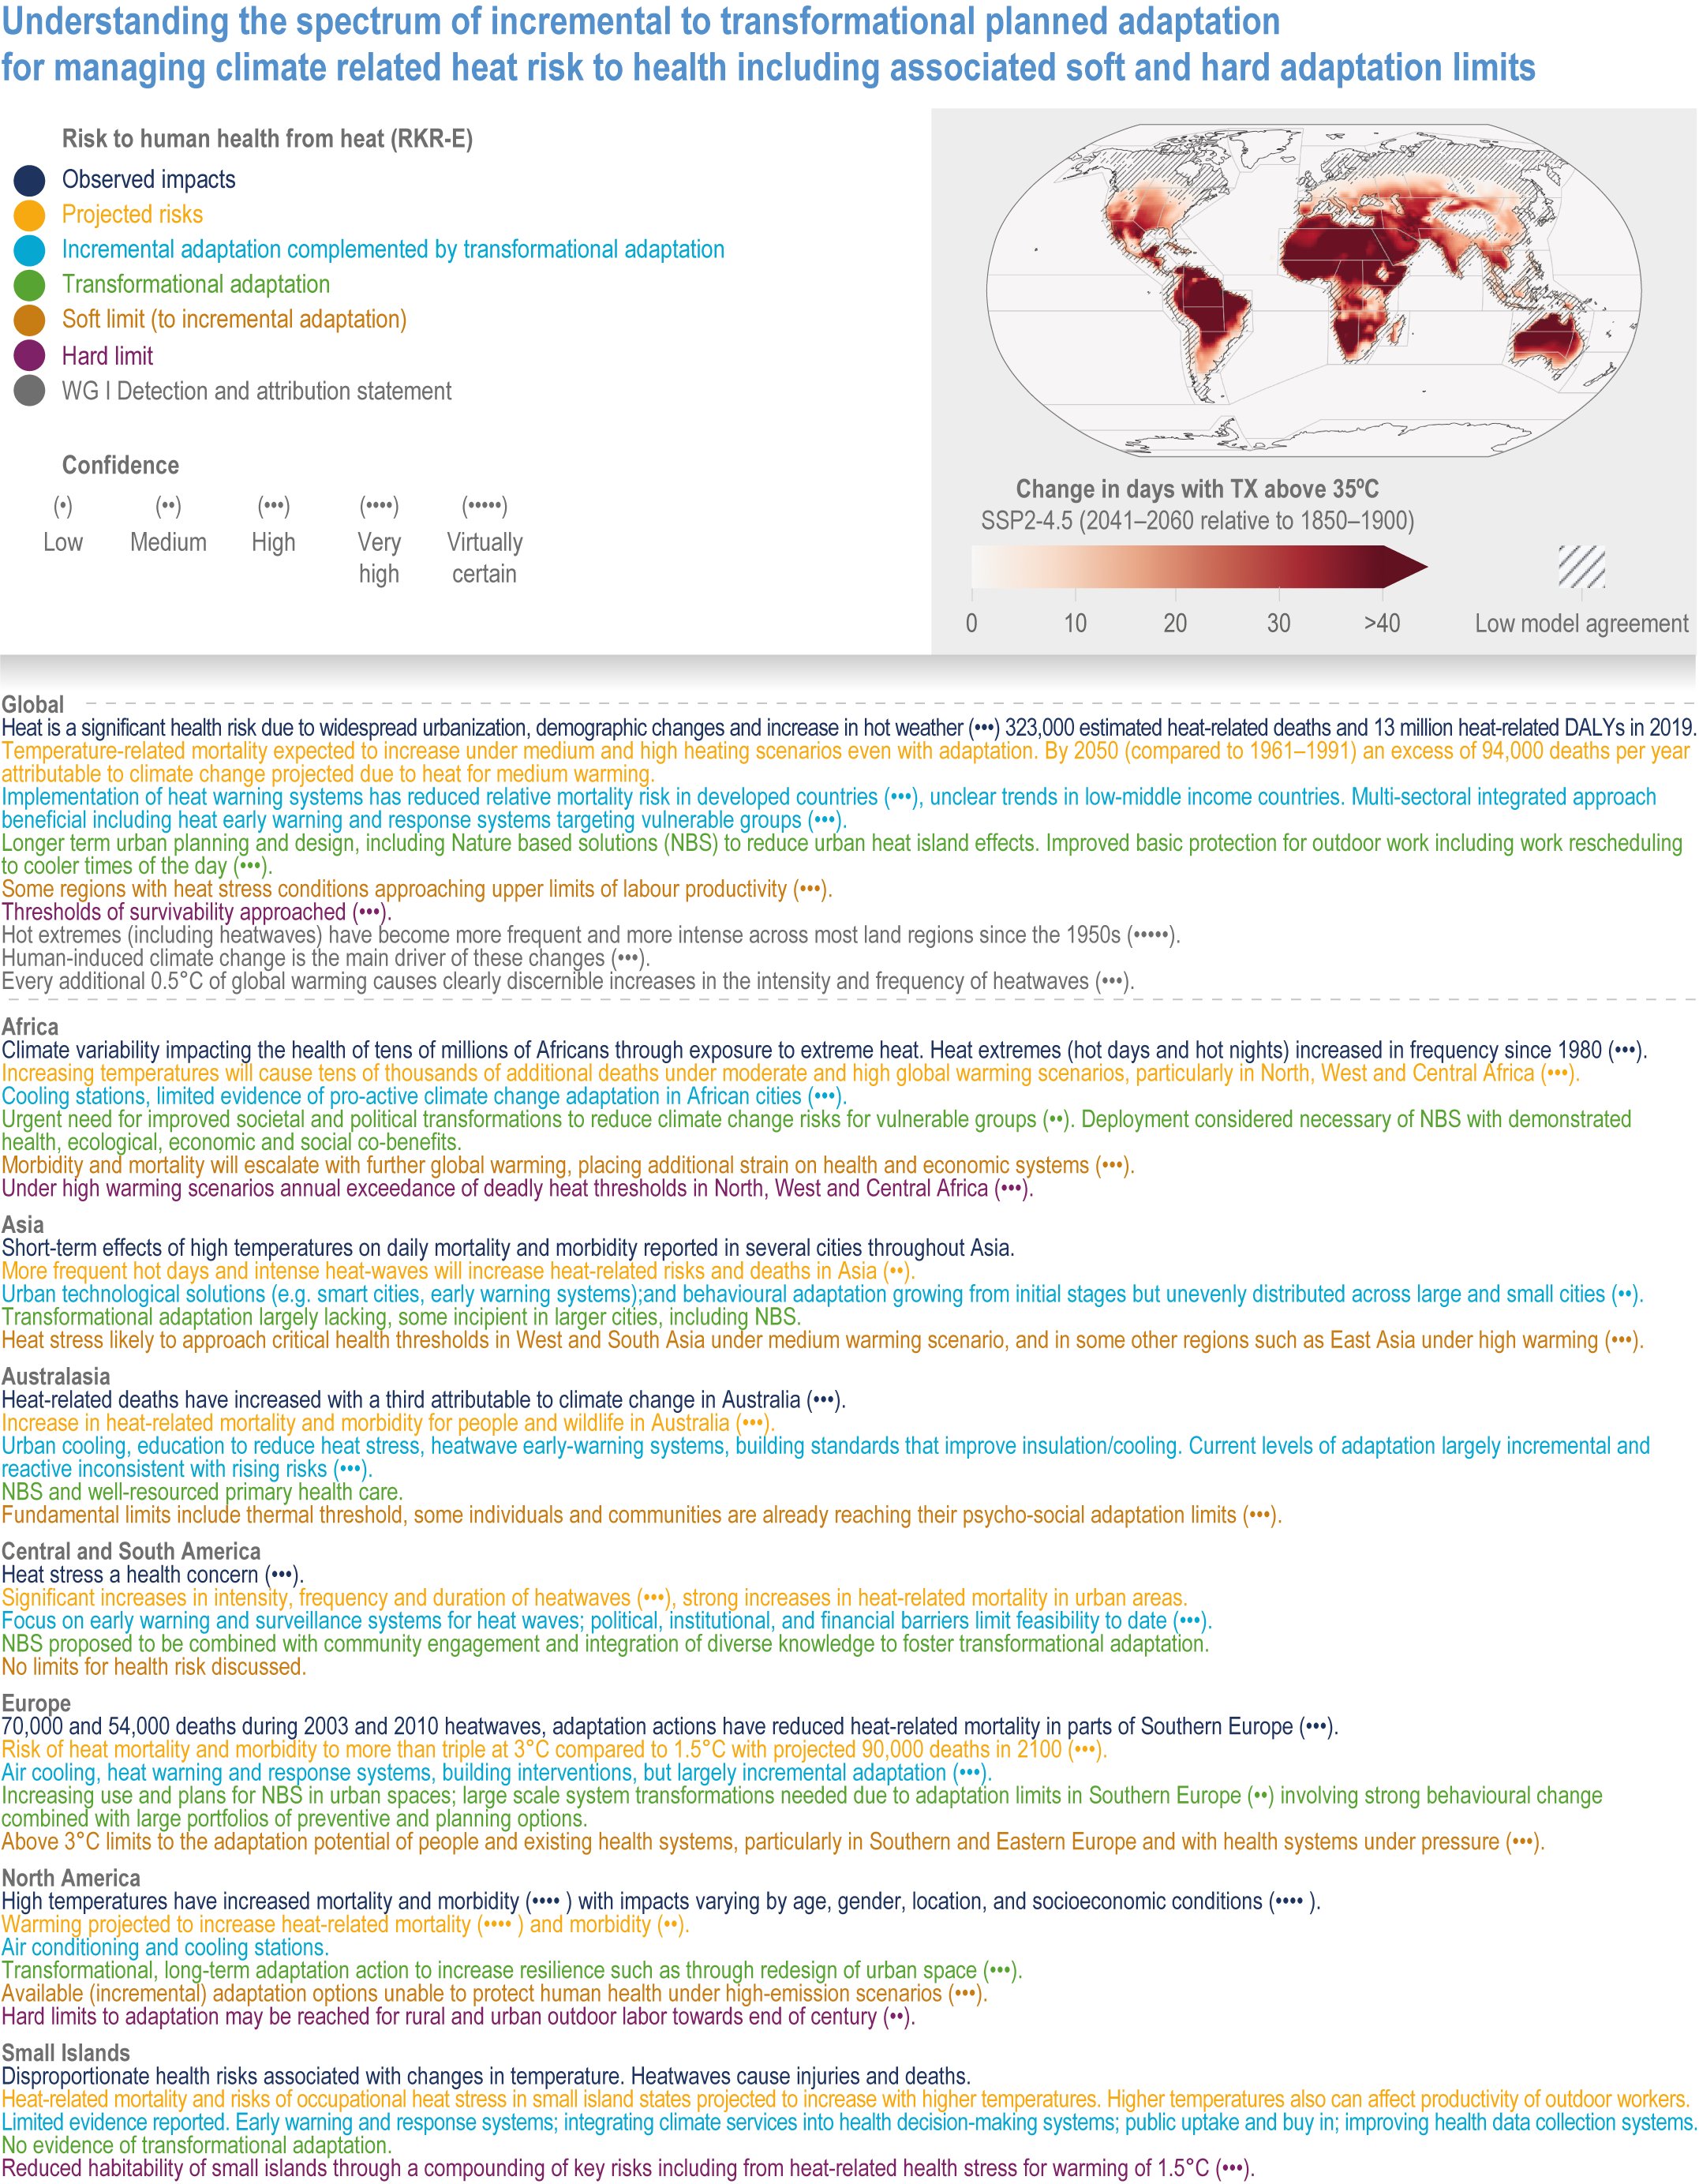
Figure caption
Figure 17.6 | Understanding the spectrum of incremental to transformational planned adaptation for managing climate related heat risk to health including associated soft and hard adaptation limits (Representative Key Risk-E (RKR-E)). Evidence from regional and thematic chapters. The figure from the WGI Atlas shows the change in extreme hot days (above 35°C) across regions for a medium-term scenario and medium global warming relative to 1850–1900. See Table SM17.19.