Figure 17.11
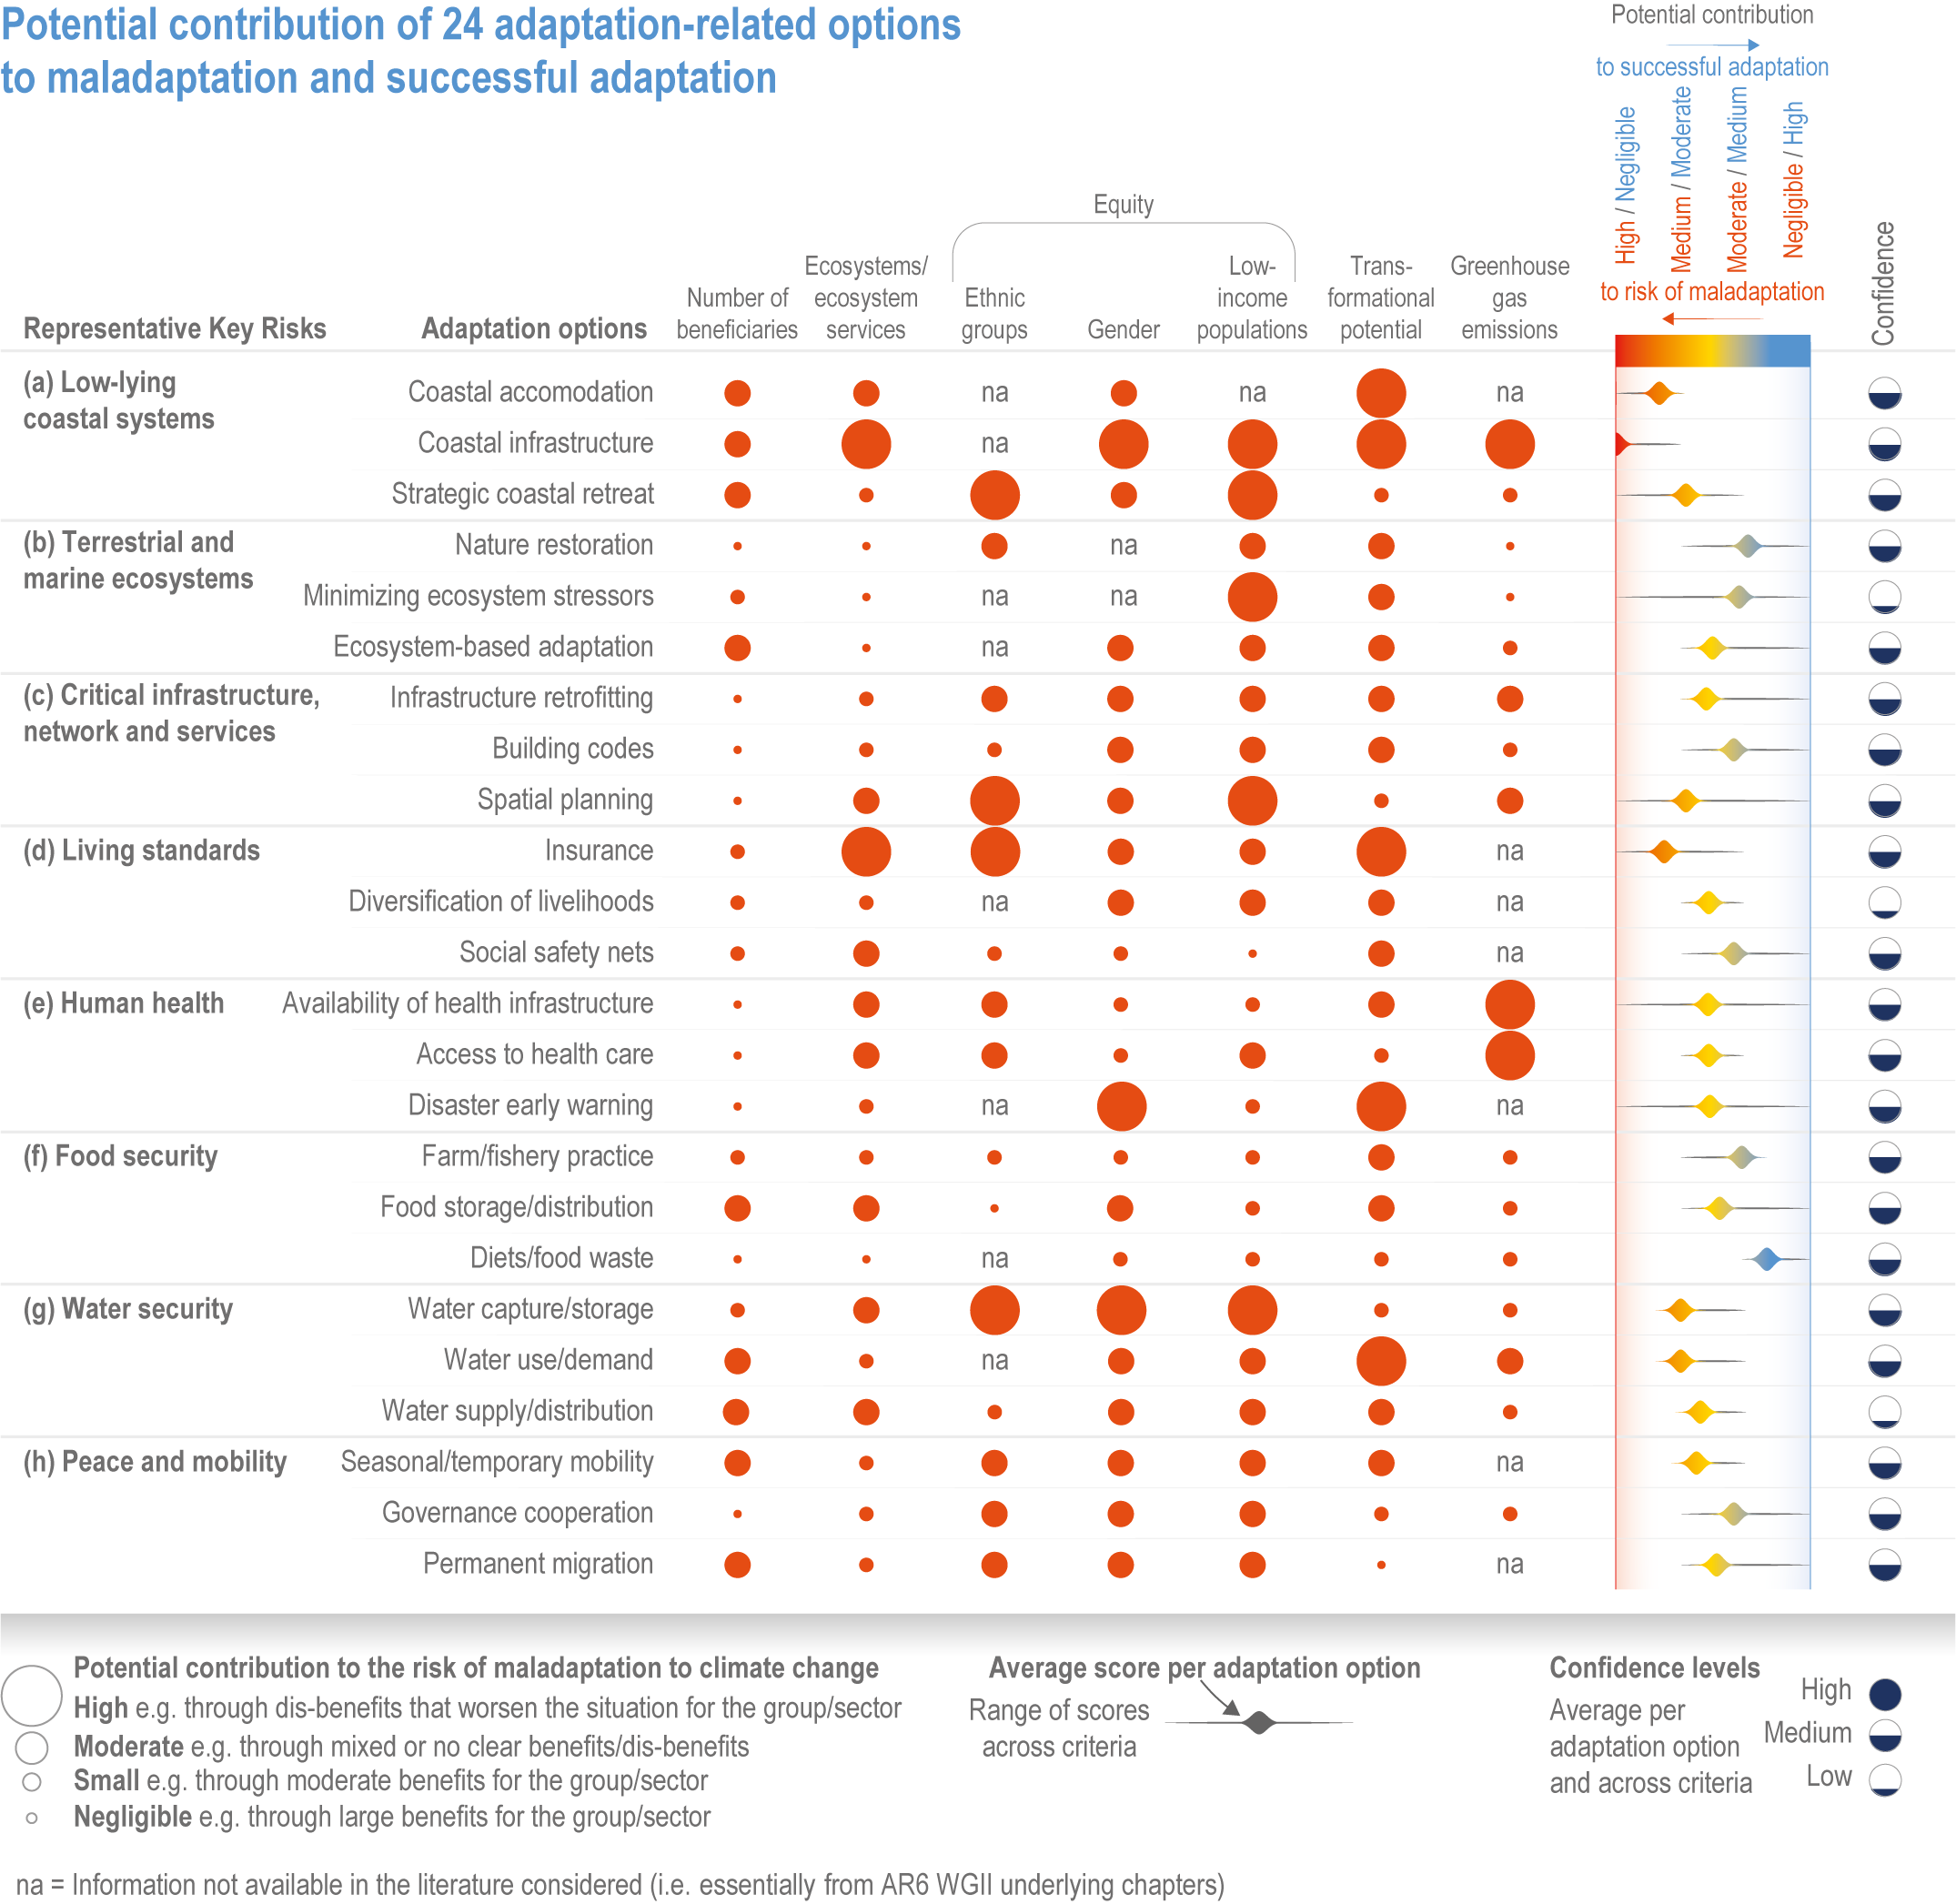
Figure caption
Figure 17.11 | The potential contribution of 24 adaptation-related options to maladaptation and successful adaptation. The figure builds on evidence provided in the underlying sectoral and regional chapters and the Cross-Chapter Papers (SM17.1) to map 24 adaptation options identified as relevant to the eight Representative Key Risks (see Section 16.5) onto the adaptation–maladaptation continuum. It assesses the potential contribution of each of these adaptation options to successful adaptation and the risk of maladaptation. The figure permits a review of options in multiple ways: (a) looking at adaptation options (first column), one can see which adaptation options score highest across the criteria (the central rows). Results by options show which ones carry the highest risk of maladaptation (largest circles per row); (b): looking at criteria (top centre), one can see which criteria seem to be most influential to contribute to maladaptation outcomes (largest circles per central column); (c) panel on the right: merging the scores of each adaptation option across criteria helps highlight whether the options are likely to end up as successful adaptation or maladaptation.