Figure 18.5
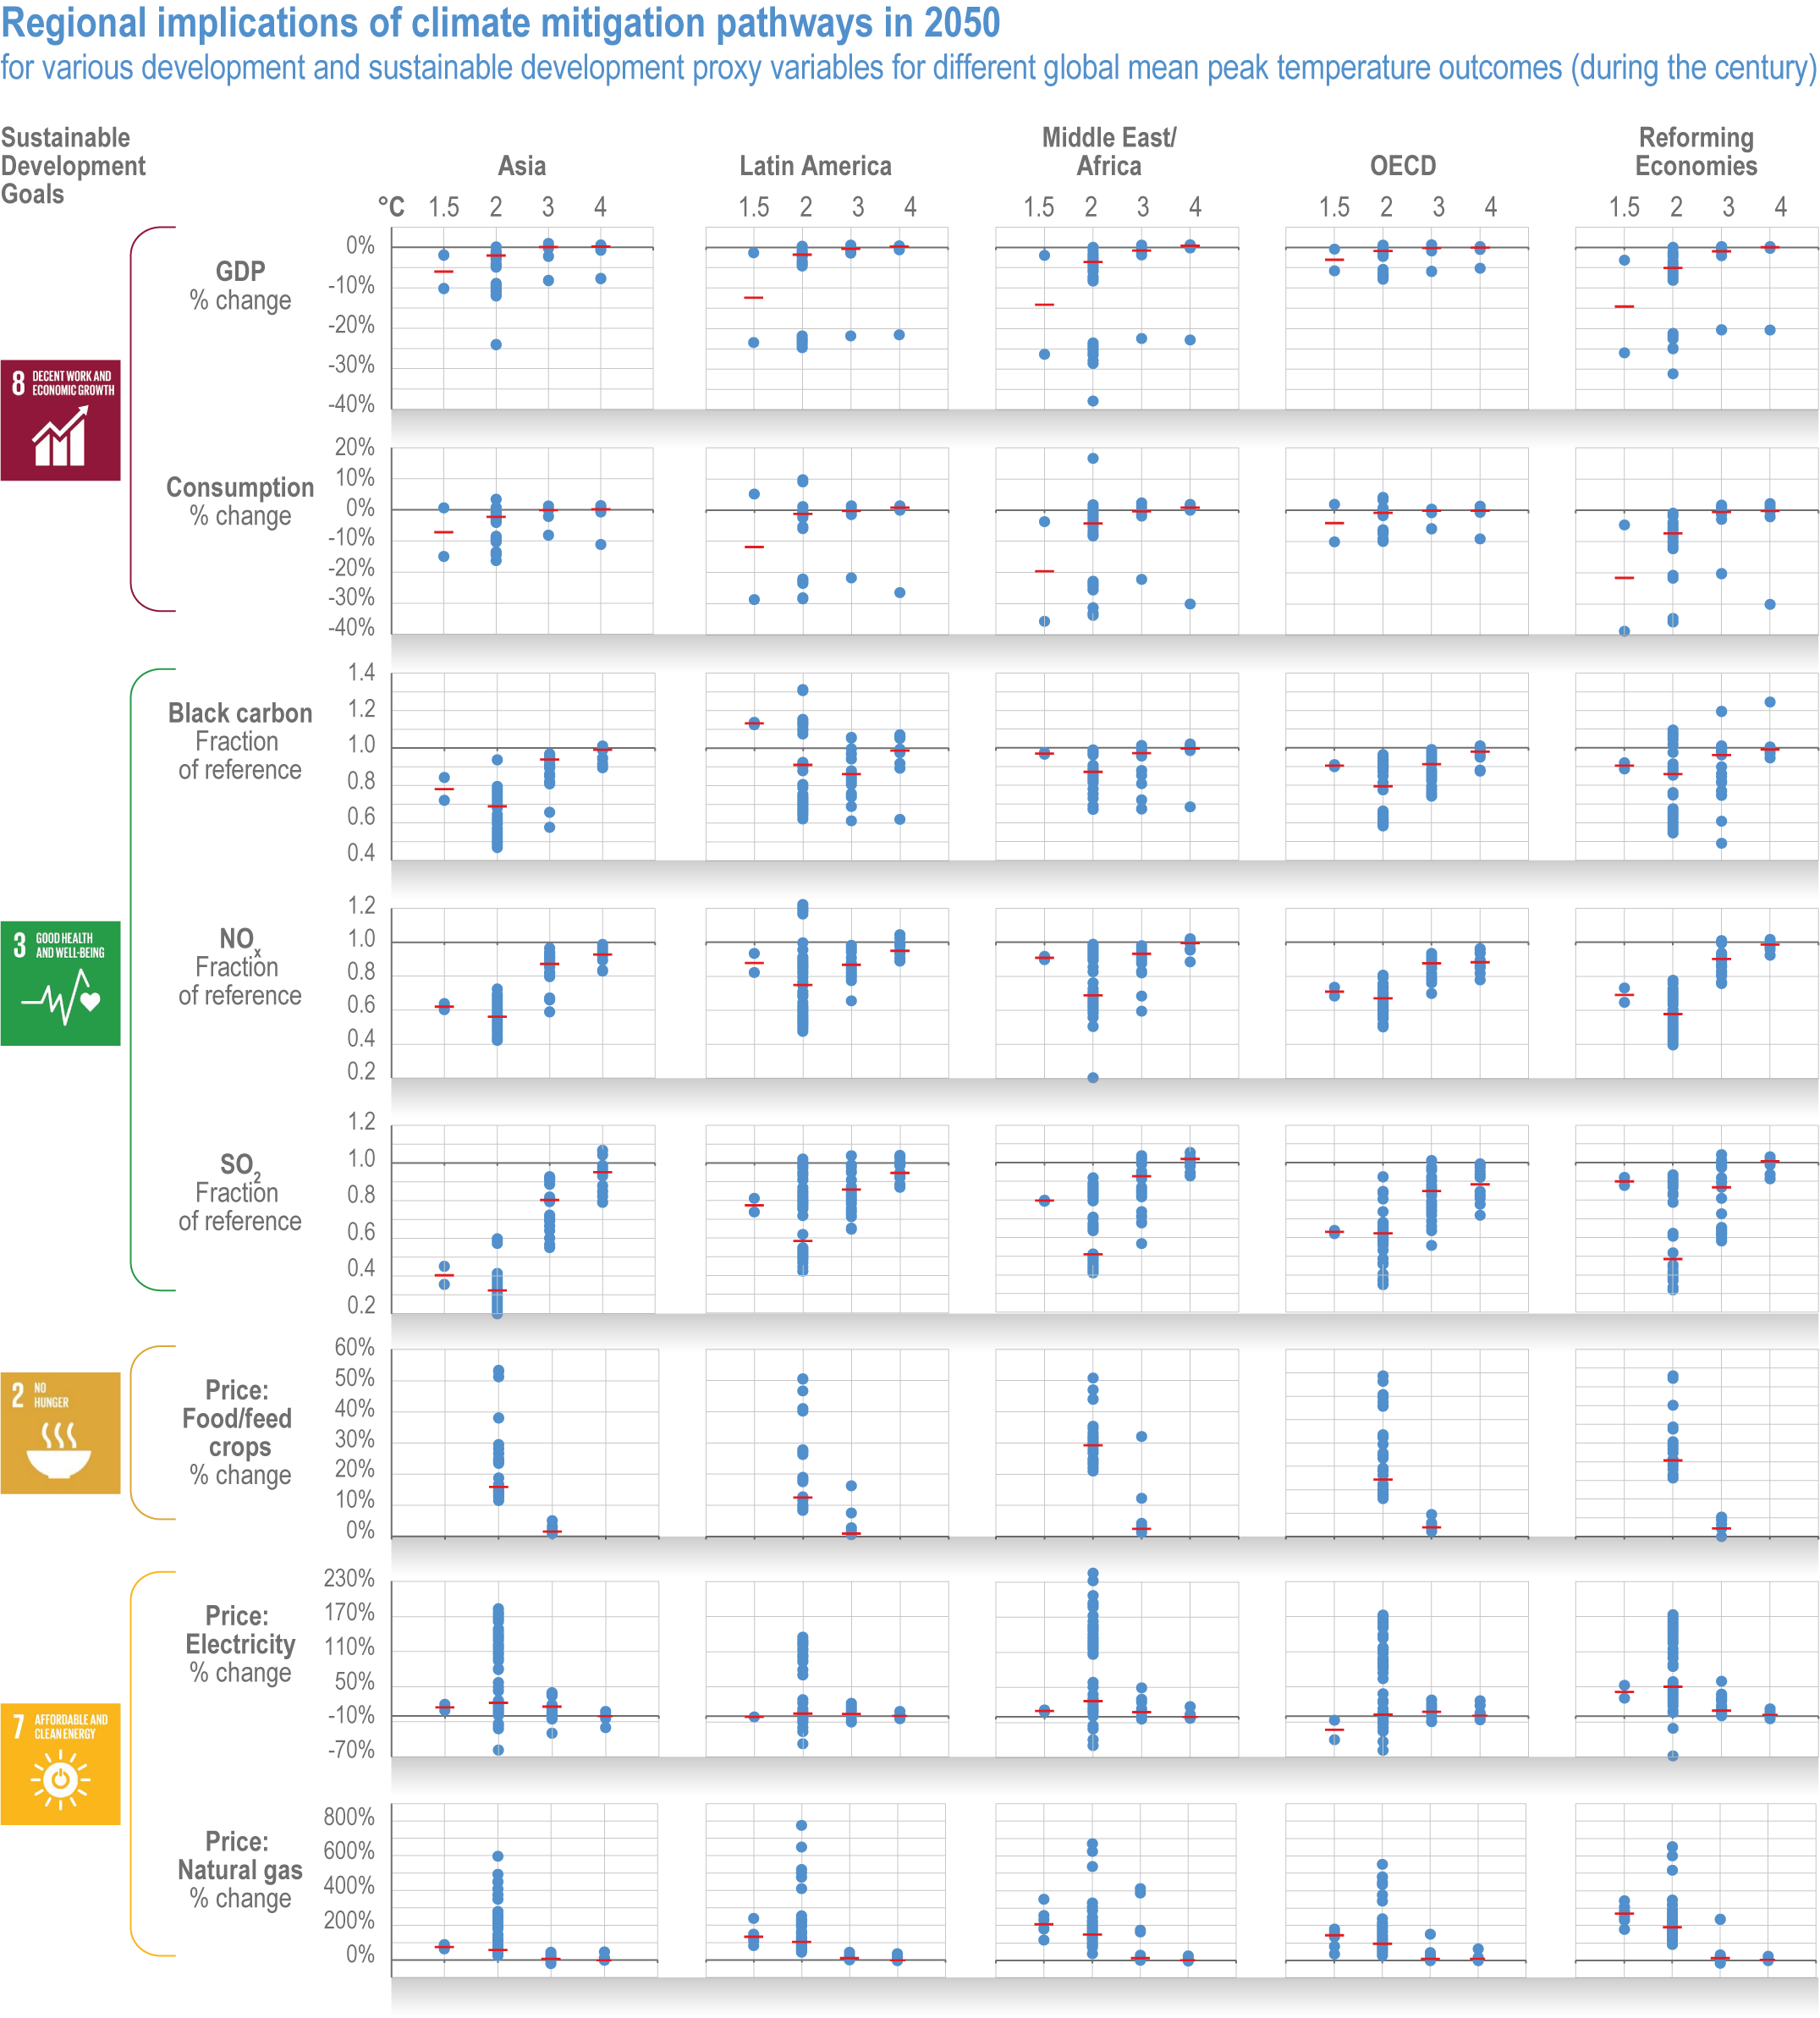
Figure caption
Figure 18.5 | Regional implications of climate mitigation pathways in 2050 for different global mean peak temperature outcomes (during the century) for various development and sustainable development proxy variables. Each row reports results for a different variable for each of the five global regions (columns) used by WGIII, and SDG associated with each variable is noted. Blue dots represent individual emissions scenario results from each of the respective WGIII climate outcome scenario categories, with red bars the median results. All results are changes (percentage or fraction) relative to each WGIII scenario’s reference scenario. In some circumstances the reference case emissions are below those from the scenario consistent with a global warming level, which can produce results that appear counter-intuitive (e.g., increases in GDP or consumption). Data sample sizes vary substantially across temperature levels for a given variable and across variables due to model infeasibilities and model differences in reporting. Model infeasibilities, in particular, result in significantly fewer data points for 1.5°C compatible emissions pathways compared to 2°C pathways (i.e., models are more often unable to solve for a 1.5°C consistent pathway, than a 2°C pathway, with a given set of assumptions). Food/feed crop price results were not available for 1.5°C and 4°C warming levels. Sample sizes for each variable and warming level respectively—1.5°C, 2°C, 3°C, and 4°C—are as follows (and apply to all regions): GDP (n = 2, 93, 29, 12); Consumption (2, 93, 30, 13); Black Carbon (2, 100, 39, 16), NOx (2, 100, 39, 15), SO2 (2, 100, 39, 16), price food/feed crops (0, 44, 23, 0); price electricity (2, 94, 38, 15); price natural gas (10, 86, 44, 10). The sample sizes are very small for the 1.5°C and 4°C results; therefore, the medians for these warming levels are statistically unreliable, which should be considered in comparing across warming levels. Individual values in the samples exceed y-axis’ ranges in a few cases: black carbon 2°C Latin America minimum equals 0.08, food/feed price change 3°C minimums in Asia, Latin America, Middle East/Africa, OECD, and Reforming Economies equal respectively -33%, -28%, -28%, -29%, and -29%, natural gas price change 2°C maximums in Asia, Latin America, Middle East/Africa, OECD, and Reforming Economies equal respectively 962%, 1240%, 2768%, 917%, and 3588%. Figure developed from the WGIII AR6 scenarios database, with scenarios filtered according to WGIII exclusions and regional vetting.