Back chapter figures
Figure Cross-Chapter Box FEASIB.3
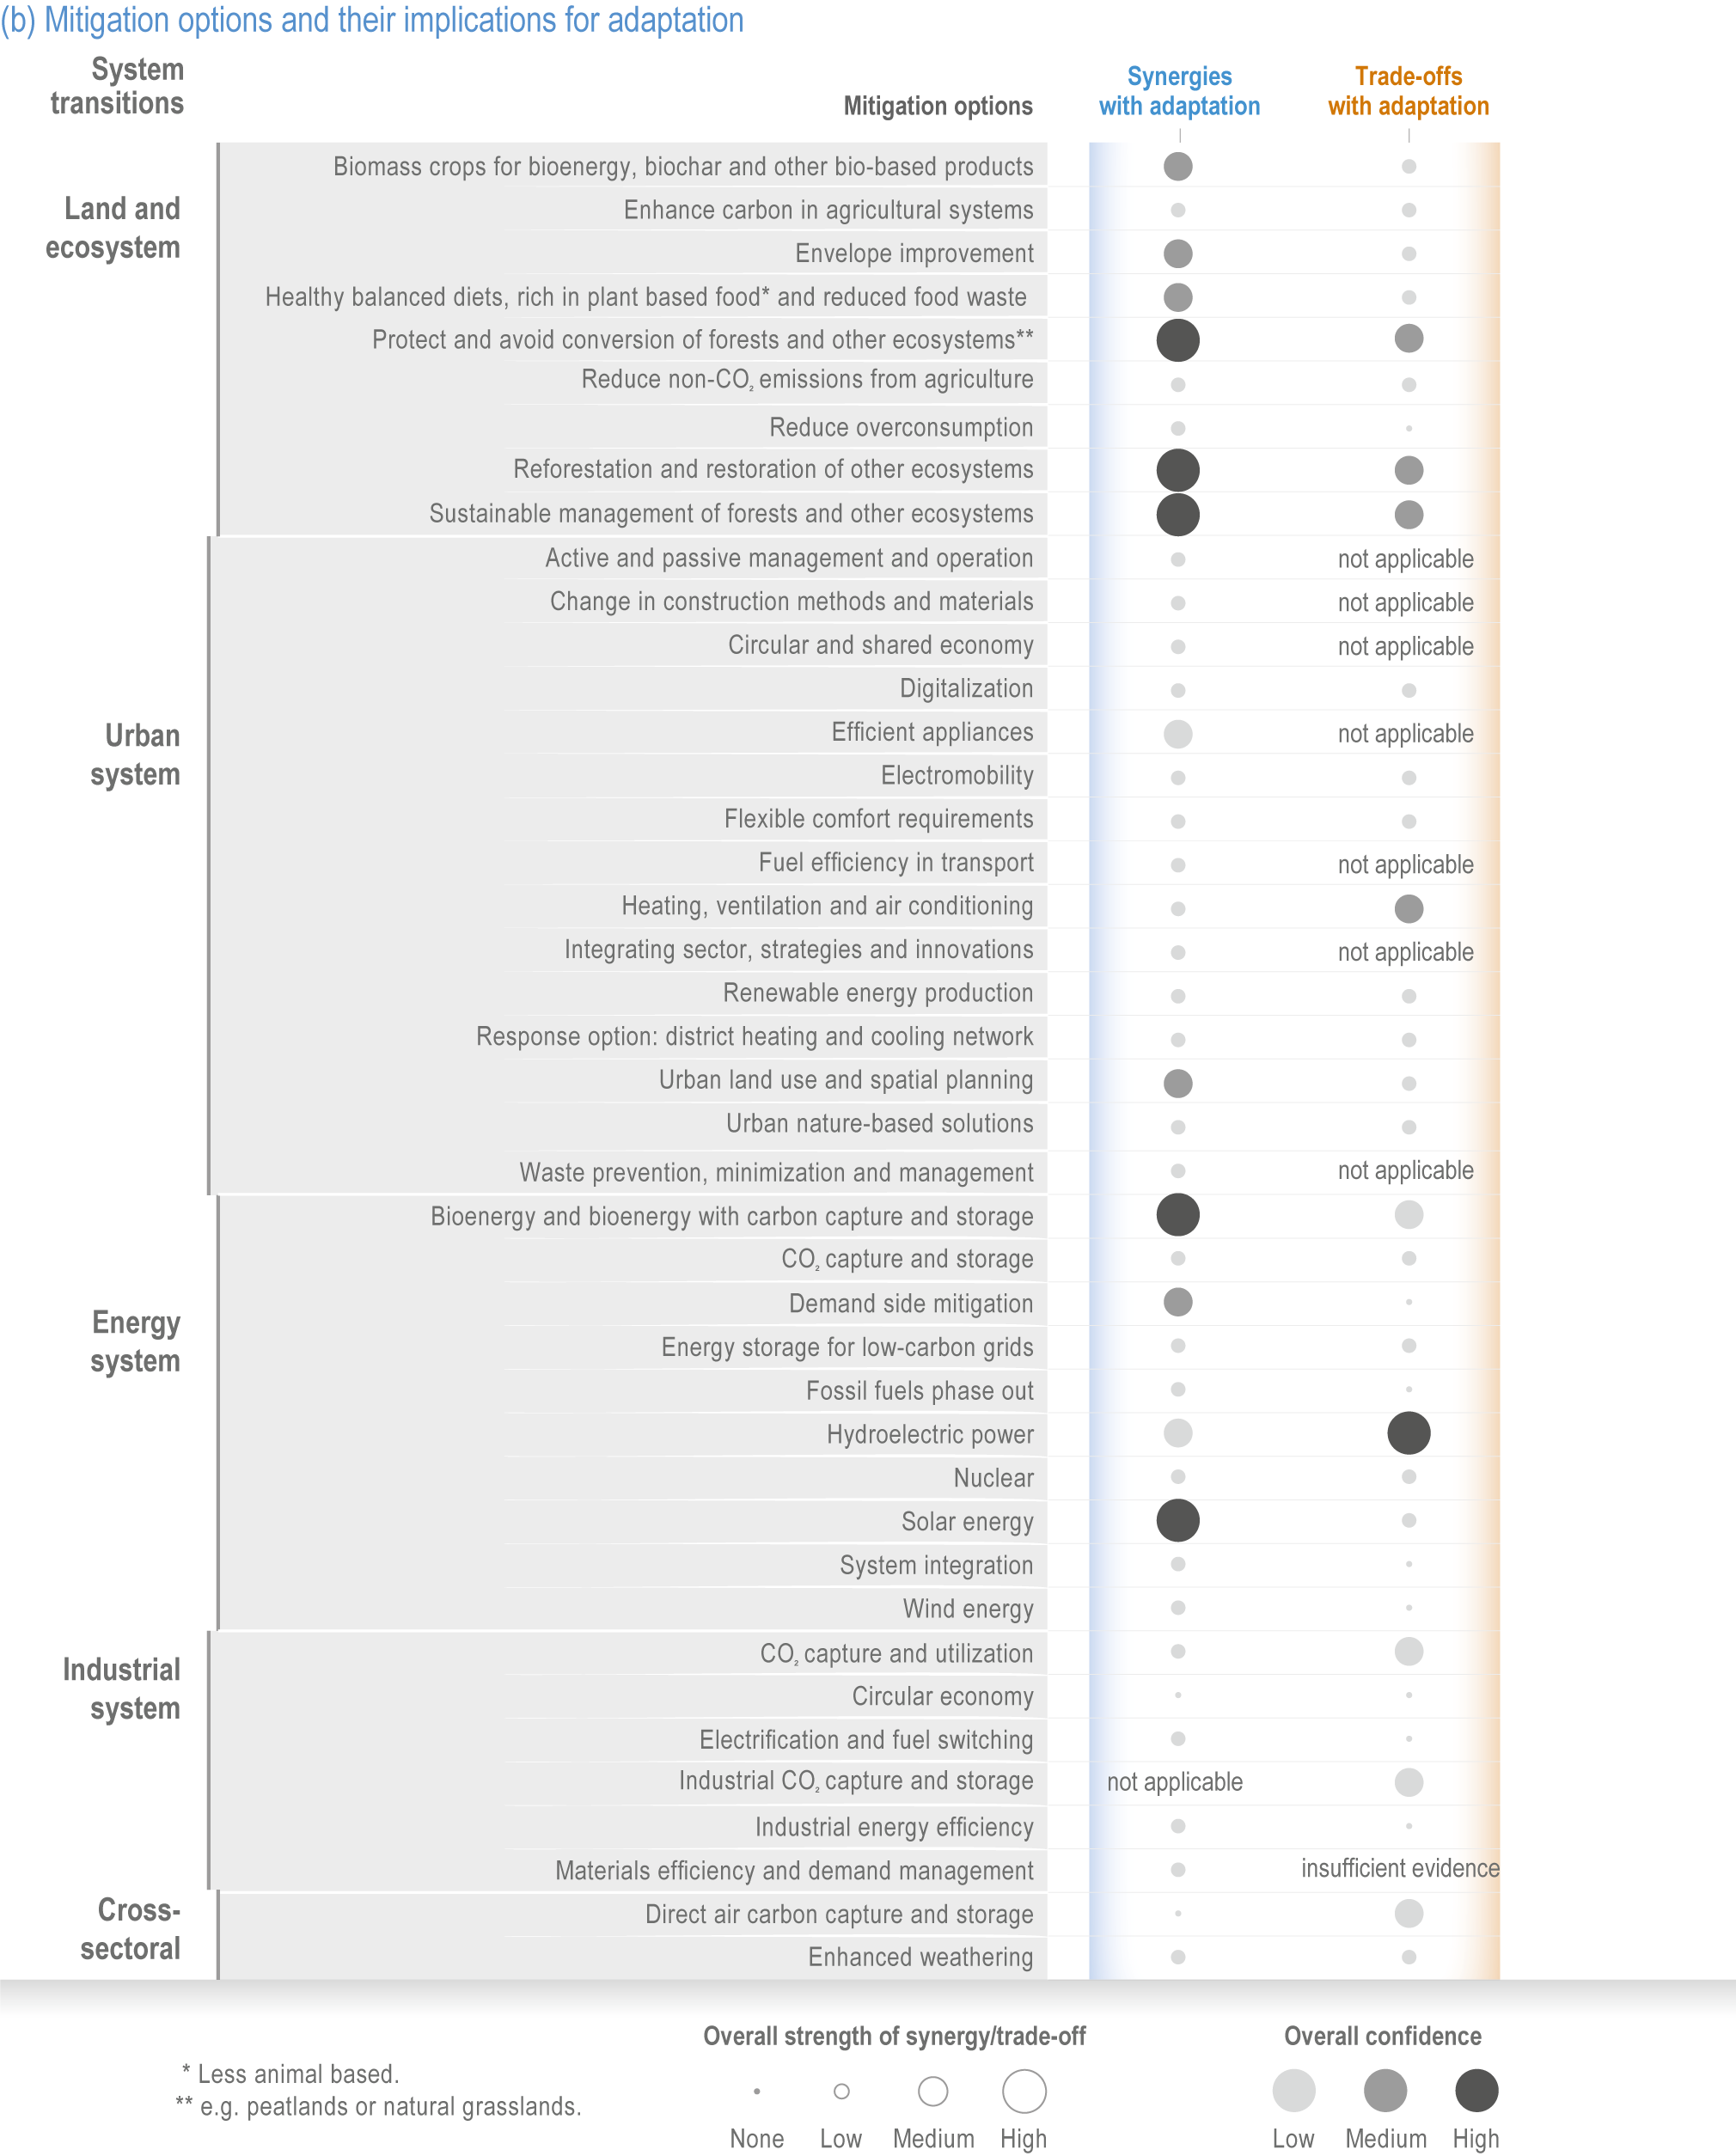
Figure caption
Figure Cross-Chapter Box FEASIB.3 | This figure shows a) adaptation options synergies and trade-offs with mitigation and b) mitigation options synergies and trade-offs with adaptation. The size of the circle denotes the strength of the synergy or trade-offs with big circles meaning strong synergy or trade-off and small circles denoting a weak synergy or trade-off.