Back chapter figures
Figure 2.1
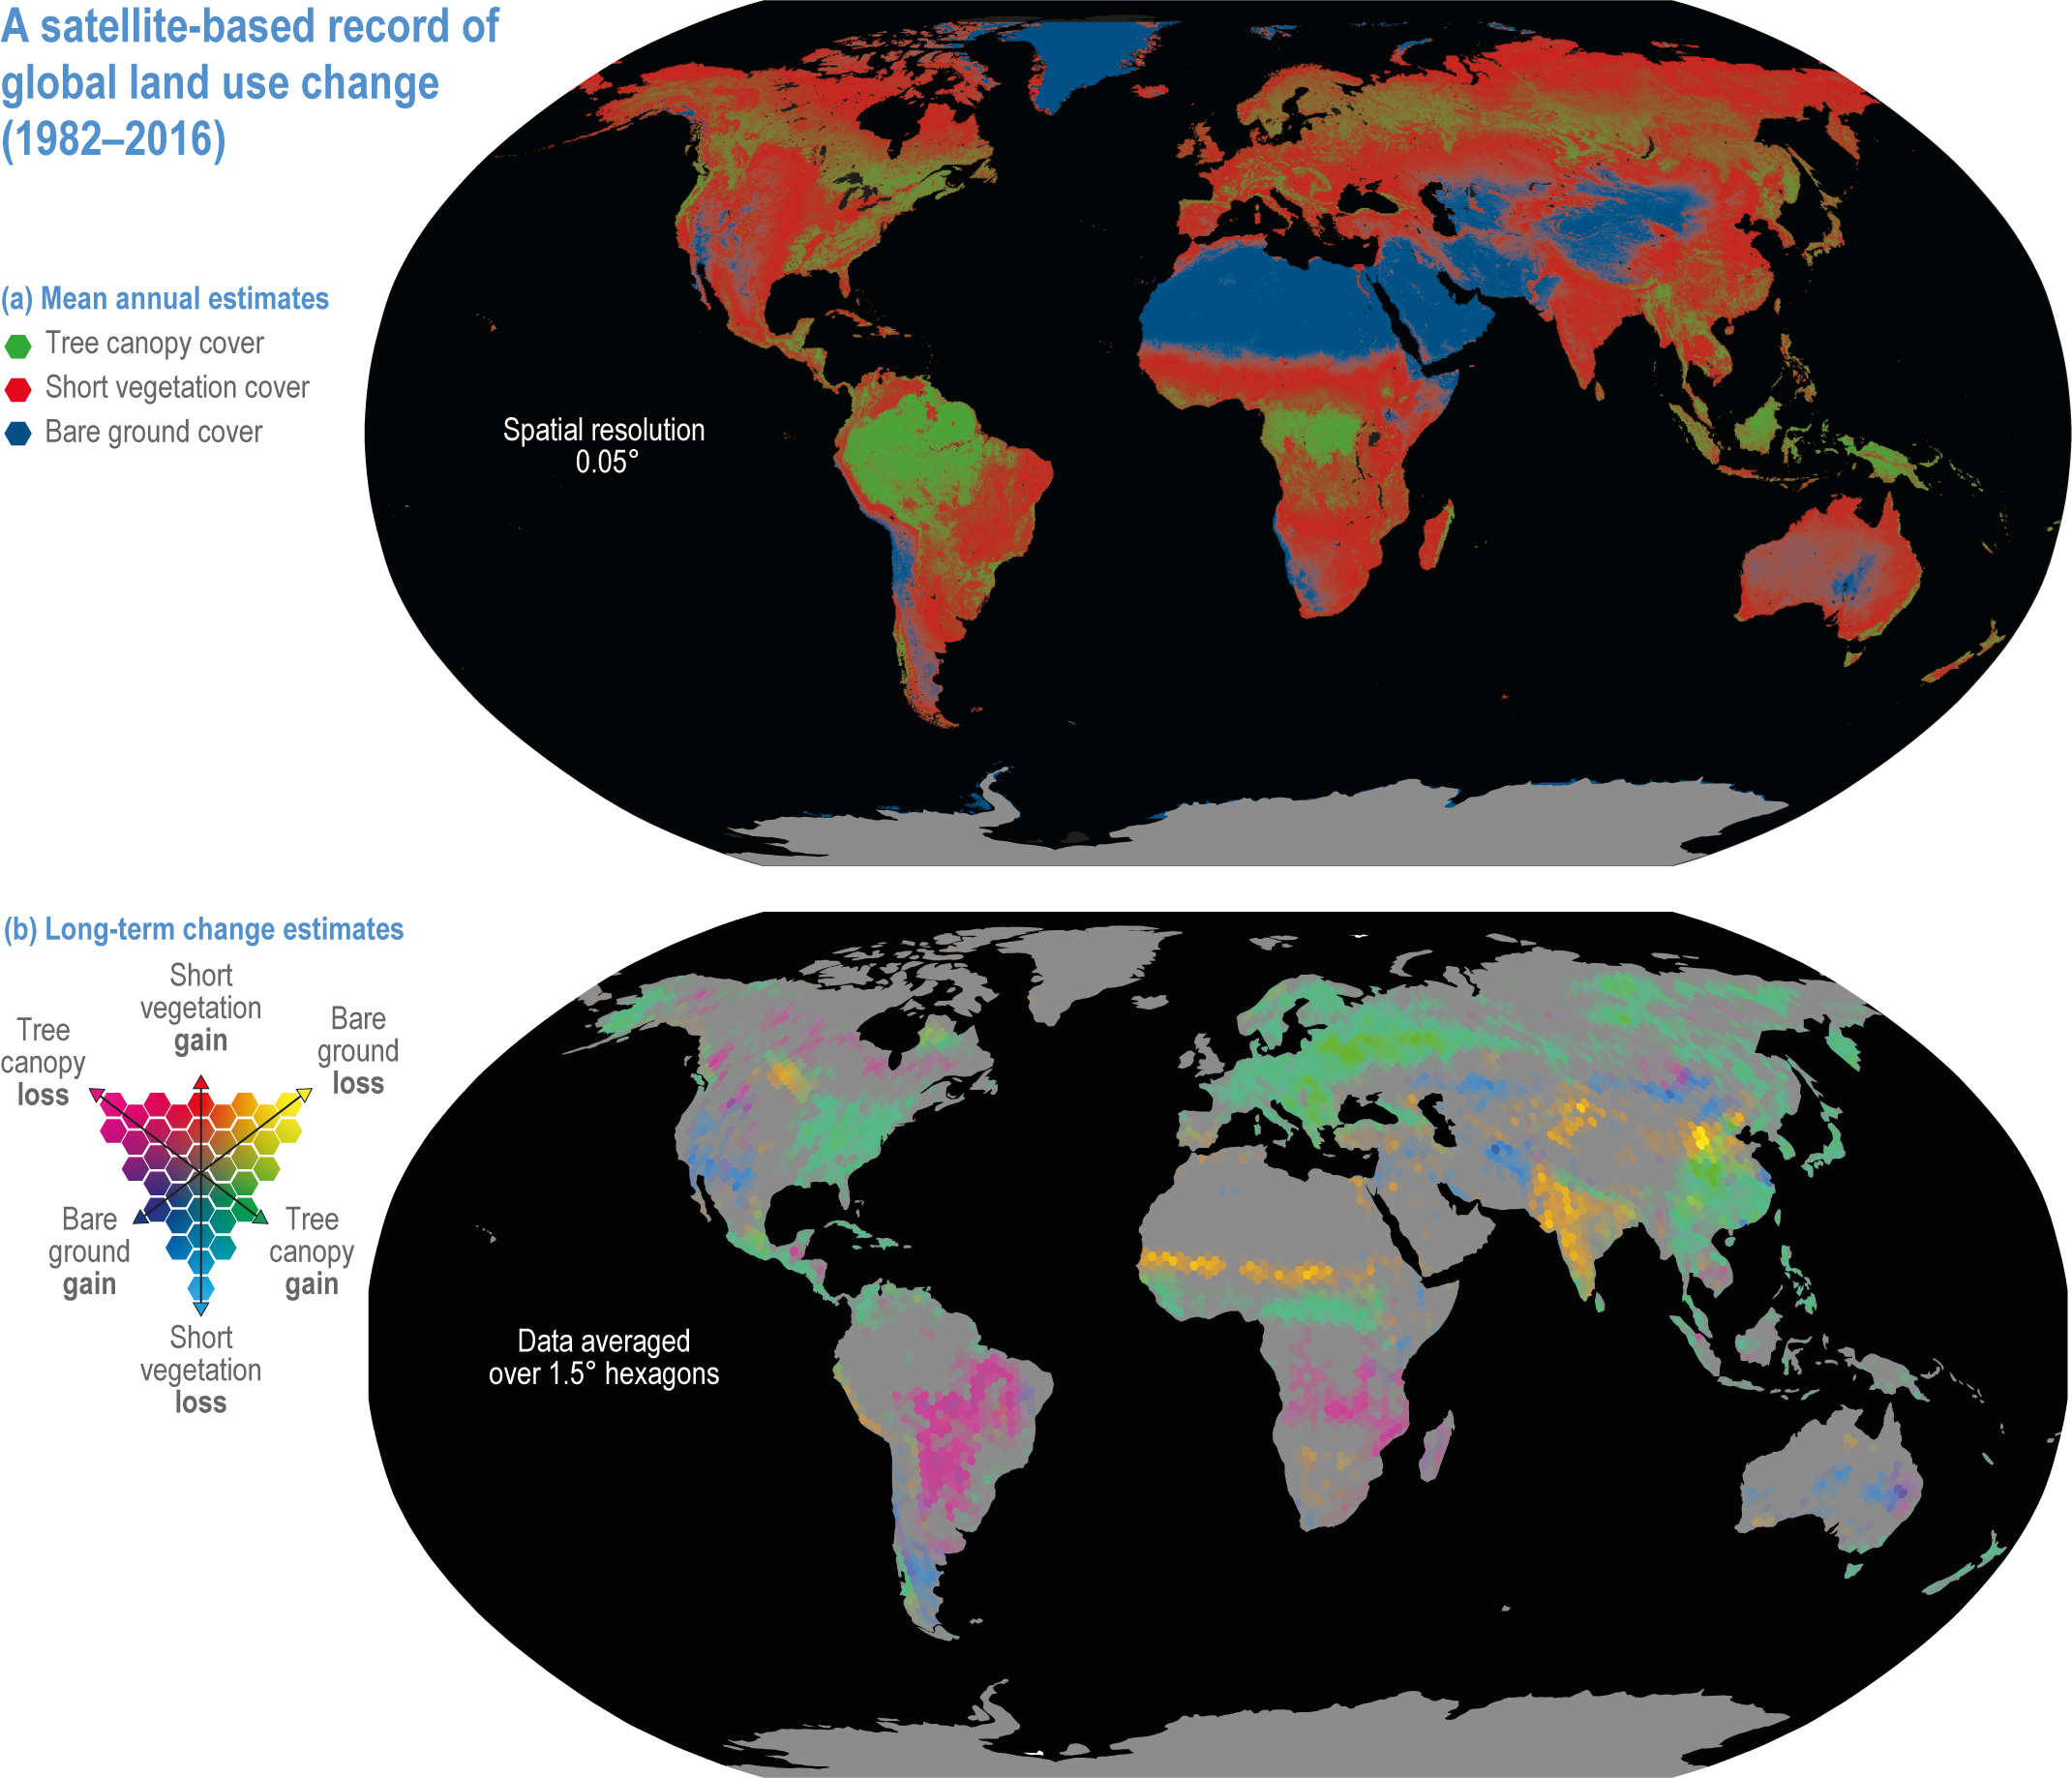
Figure caption
Figure 2.1 | Map of global land use change from 1982 to 2016. Based on satellite records of global tree canopy (TC), short vegetation (SV) and bare ground (BG) cover (from Song et al., 2018).
(a) Mean annual estimates of cover (% of pixel area at 0.05° resolution).
(b) Long-term change estimates (% of pixel area at 1.5° resolution), with pixels showing a statistically significant trend (n= 35 years, two-sided Mann–Kendall test, P < 0.05) in TC, SV or BG. The dominant changes are TC gain with SV loss; BG gain with SV loss; TC gain with BG loss; BG gain with TC loss; SV gain with BG loss; and SV gain with TC loss. Grey indicates areas with no significant change between 1982 and 2016.