Figure 2.2
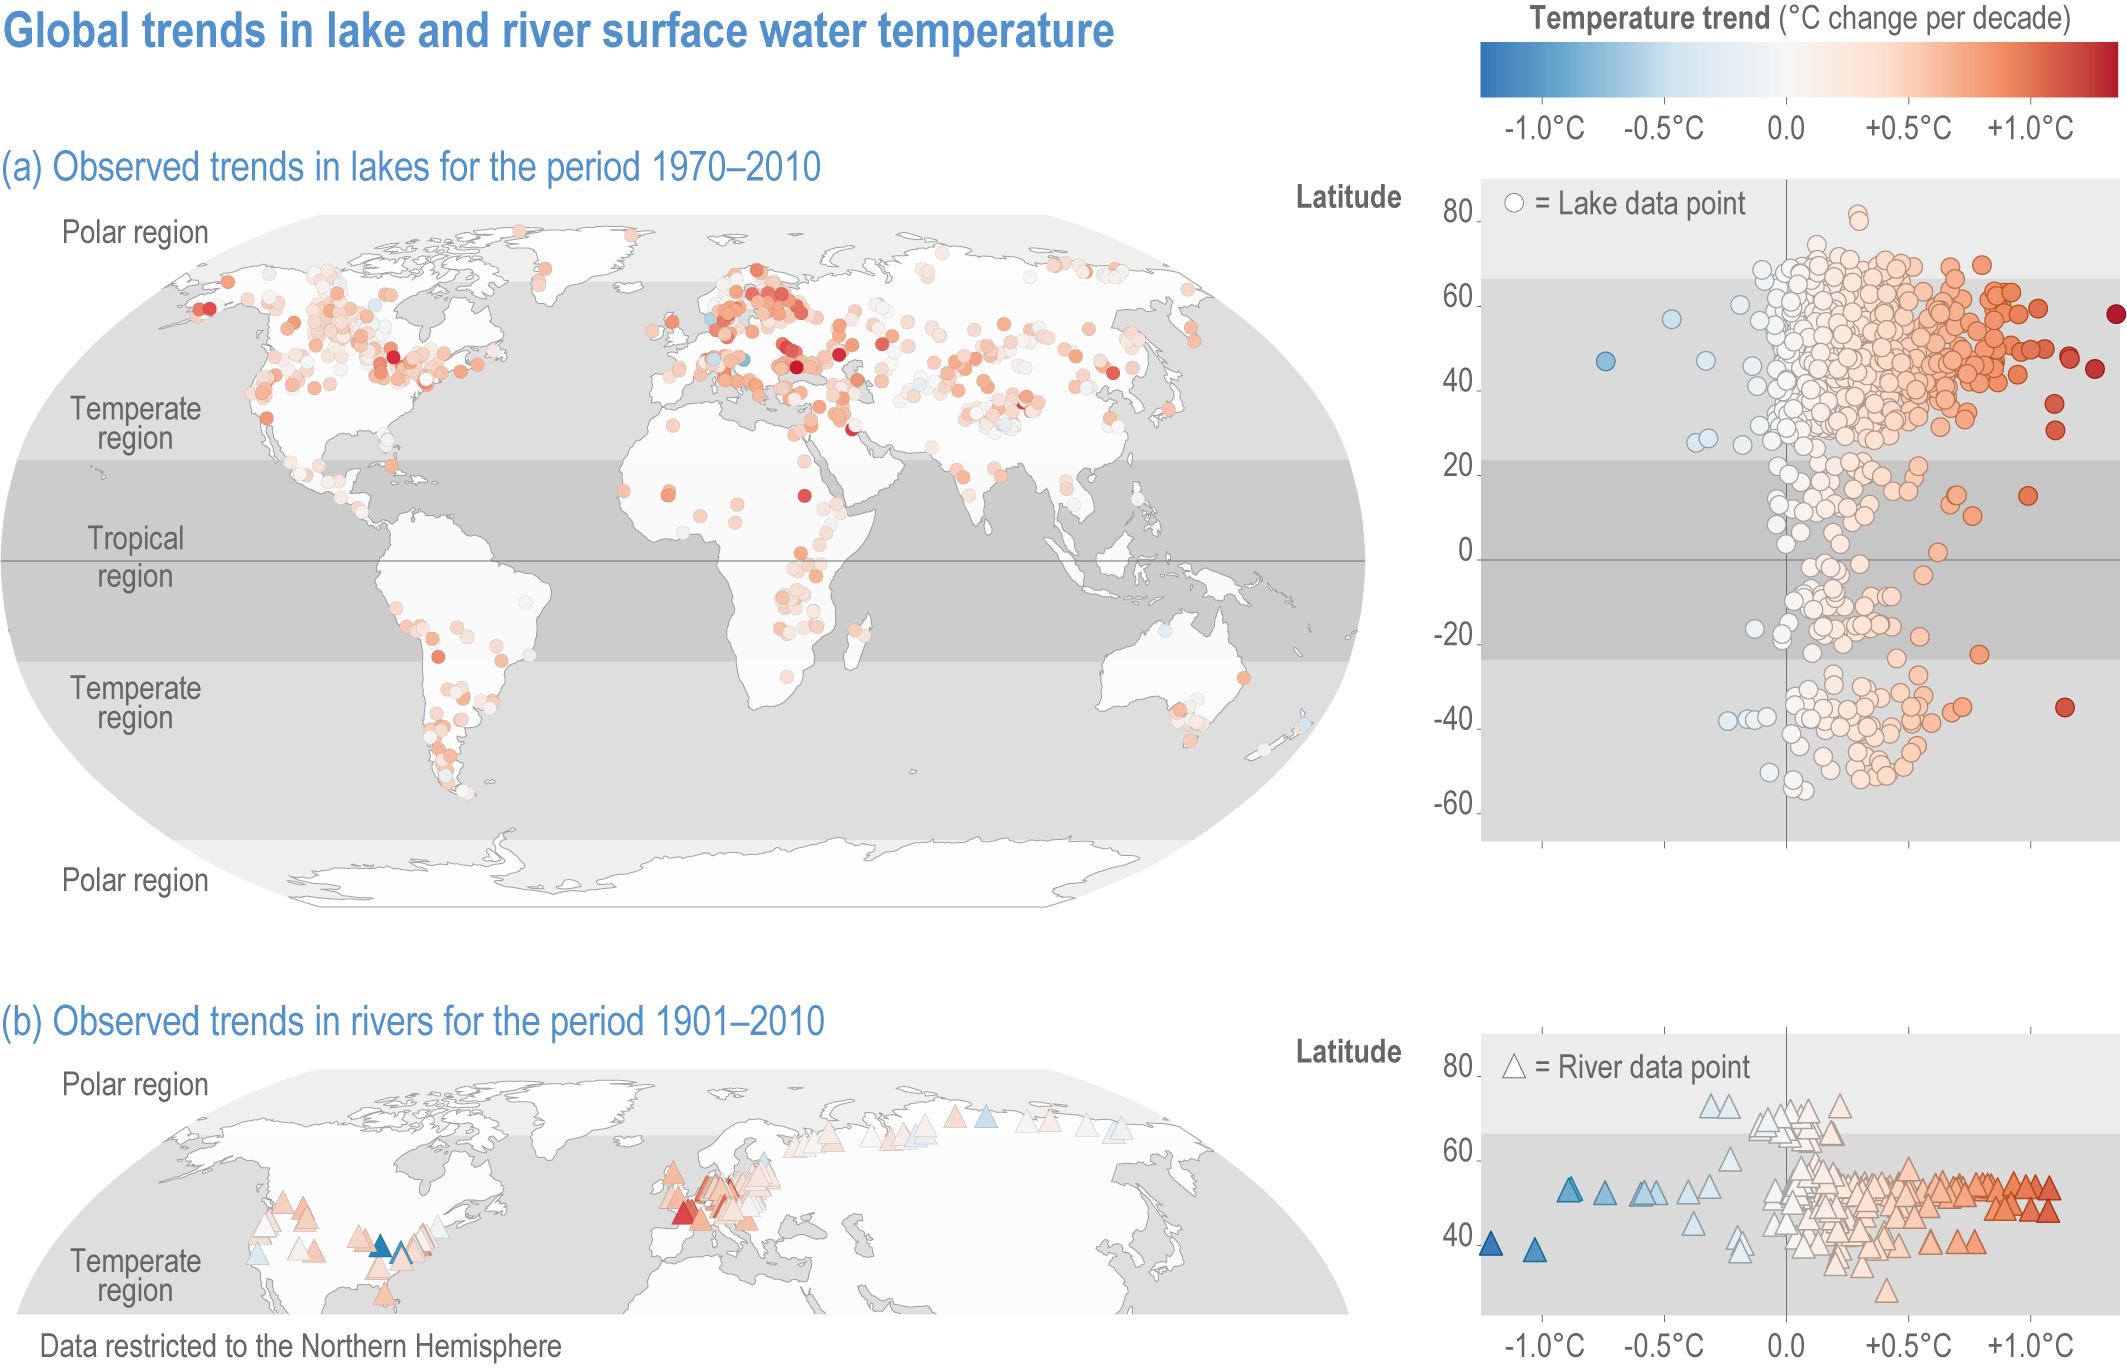
Figure caption
Figure 2.2 | Observed global trends in lake and river surface water temperature.
(a) Left panel: map of temperatures of lakes (1970–2010).
(b) Left panel: map of temperatures of rivers (1901–2010). Note that the trends of river water temperatures are not directly comparable within rivers or to lakes, since time periods are not consistent across river studies. Right panels (a) and (b) depict water temperature trends along a latitudinal gradient highlighting the above average warming rates in northern Polar Regions (polar amplification). Data sources for lakes: (O’Reilly et al., 2015; Carrea and Merchant, 2019; Woolway et al., 2020a; Woolway et al., 2020b). Data sources for rivers: (Webb and Walling, 1992; Langan et al., 2001; Daufresne et al., 2004; Moatar and Gailhard, 2006; Lammers et al., 2007; Patterson et al., 2007; Webb and Nobilis, 2007; Durance and Ormerod, 2009; Kaushal et al., 2010; Pekárová et al., 2011; Jurgelėnaitė et al., 2012; Markovic et al., 2013; Arora et al., 2016; Latkovska and Apsīte, 2016; Marszelewski and Pius, 2016; Jurgelėnaitė et al., 2017).