Figure 2.7
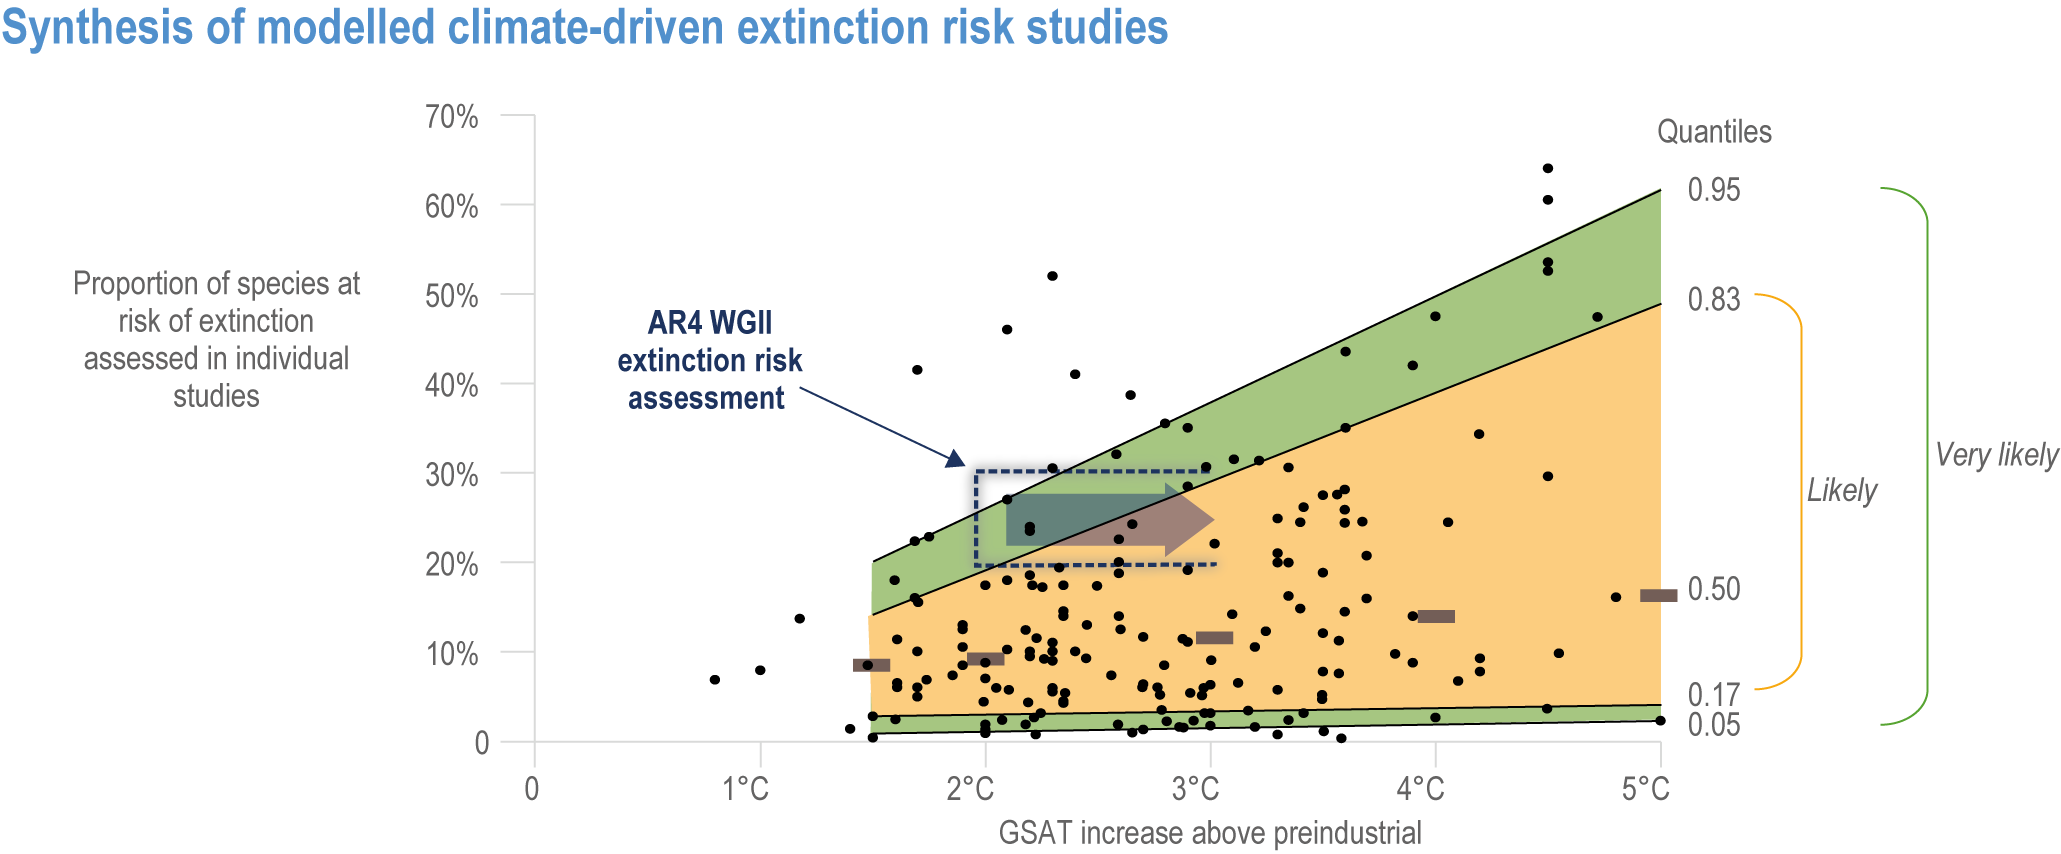
Figure caption
Figure 2.7 | Global assessment of species’ extinction risks under different levels of warming. Graph shows a synthesis of climate-driven models of individual species projected to become at very high risk of extinction globally (i.e, becoming “critically endandered” sensu IUCN by losing >80% of their suitable climate space or through estimates of extinction risk from process-based models). The relationship between modelled projections of extinction (expressed as a proportion of species at a risk of extinction assessed in individual studies) and GSAT increase above the pre-industrial average. Data (global sample size n = 178 modelled estimates) were taken from a number of sources, including digitization of data points in Figure 2 in the synthetic analysis of (Urban, 2015) (note: unweighted for sample size) n = 126; Table 4.1 of AR4 WGII Chapter 2 (Fischlin et al., 2007), n = 40; (Hannah et al., 2020) n = 6; and (Warren et al., 2018) n = 6. The quantile regression (which is robust to the non-normal distribution of the response variable, and less sensitive to data outliers) was chosen as a descriptive statistic to fit quantile estimates for levels relevant to informing likely (between the 0.17 and 0.83 quantiles, shaded in orange) and very likely ranges (between the 0.05 and 0.95 quantiles, shaded in green) relating extinction risk to GSAT increase (quantile regression implemented using the Barrodale and Roberts algorithm in XLSTAT). The roughly equivalent estimate of this risk as expressed in AR4 (Fischlin et al., 2007) is indicated by the dotted block indicating the medium confidence statement ‘Approximately 20–30% of plant and animal species assessed so far (in an unbiased sample) are likely to be at increasingly high risk of extinction as global mean temperatures exceed a warming of 2–3°C above pre-industrial levels (medium confidence).’ This box is open on the right side because AR4 estimates stipulated temperatures at or exceeding the given levels. Thick dark horizontal bars show the median values of percent of species at very high risk of extinction at 1.5°C, 2°C, 3°C, 4°C and 5°C, indicating that half of the data points lie above the bar and half below for a given level of global warming.