Figure 2.8
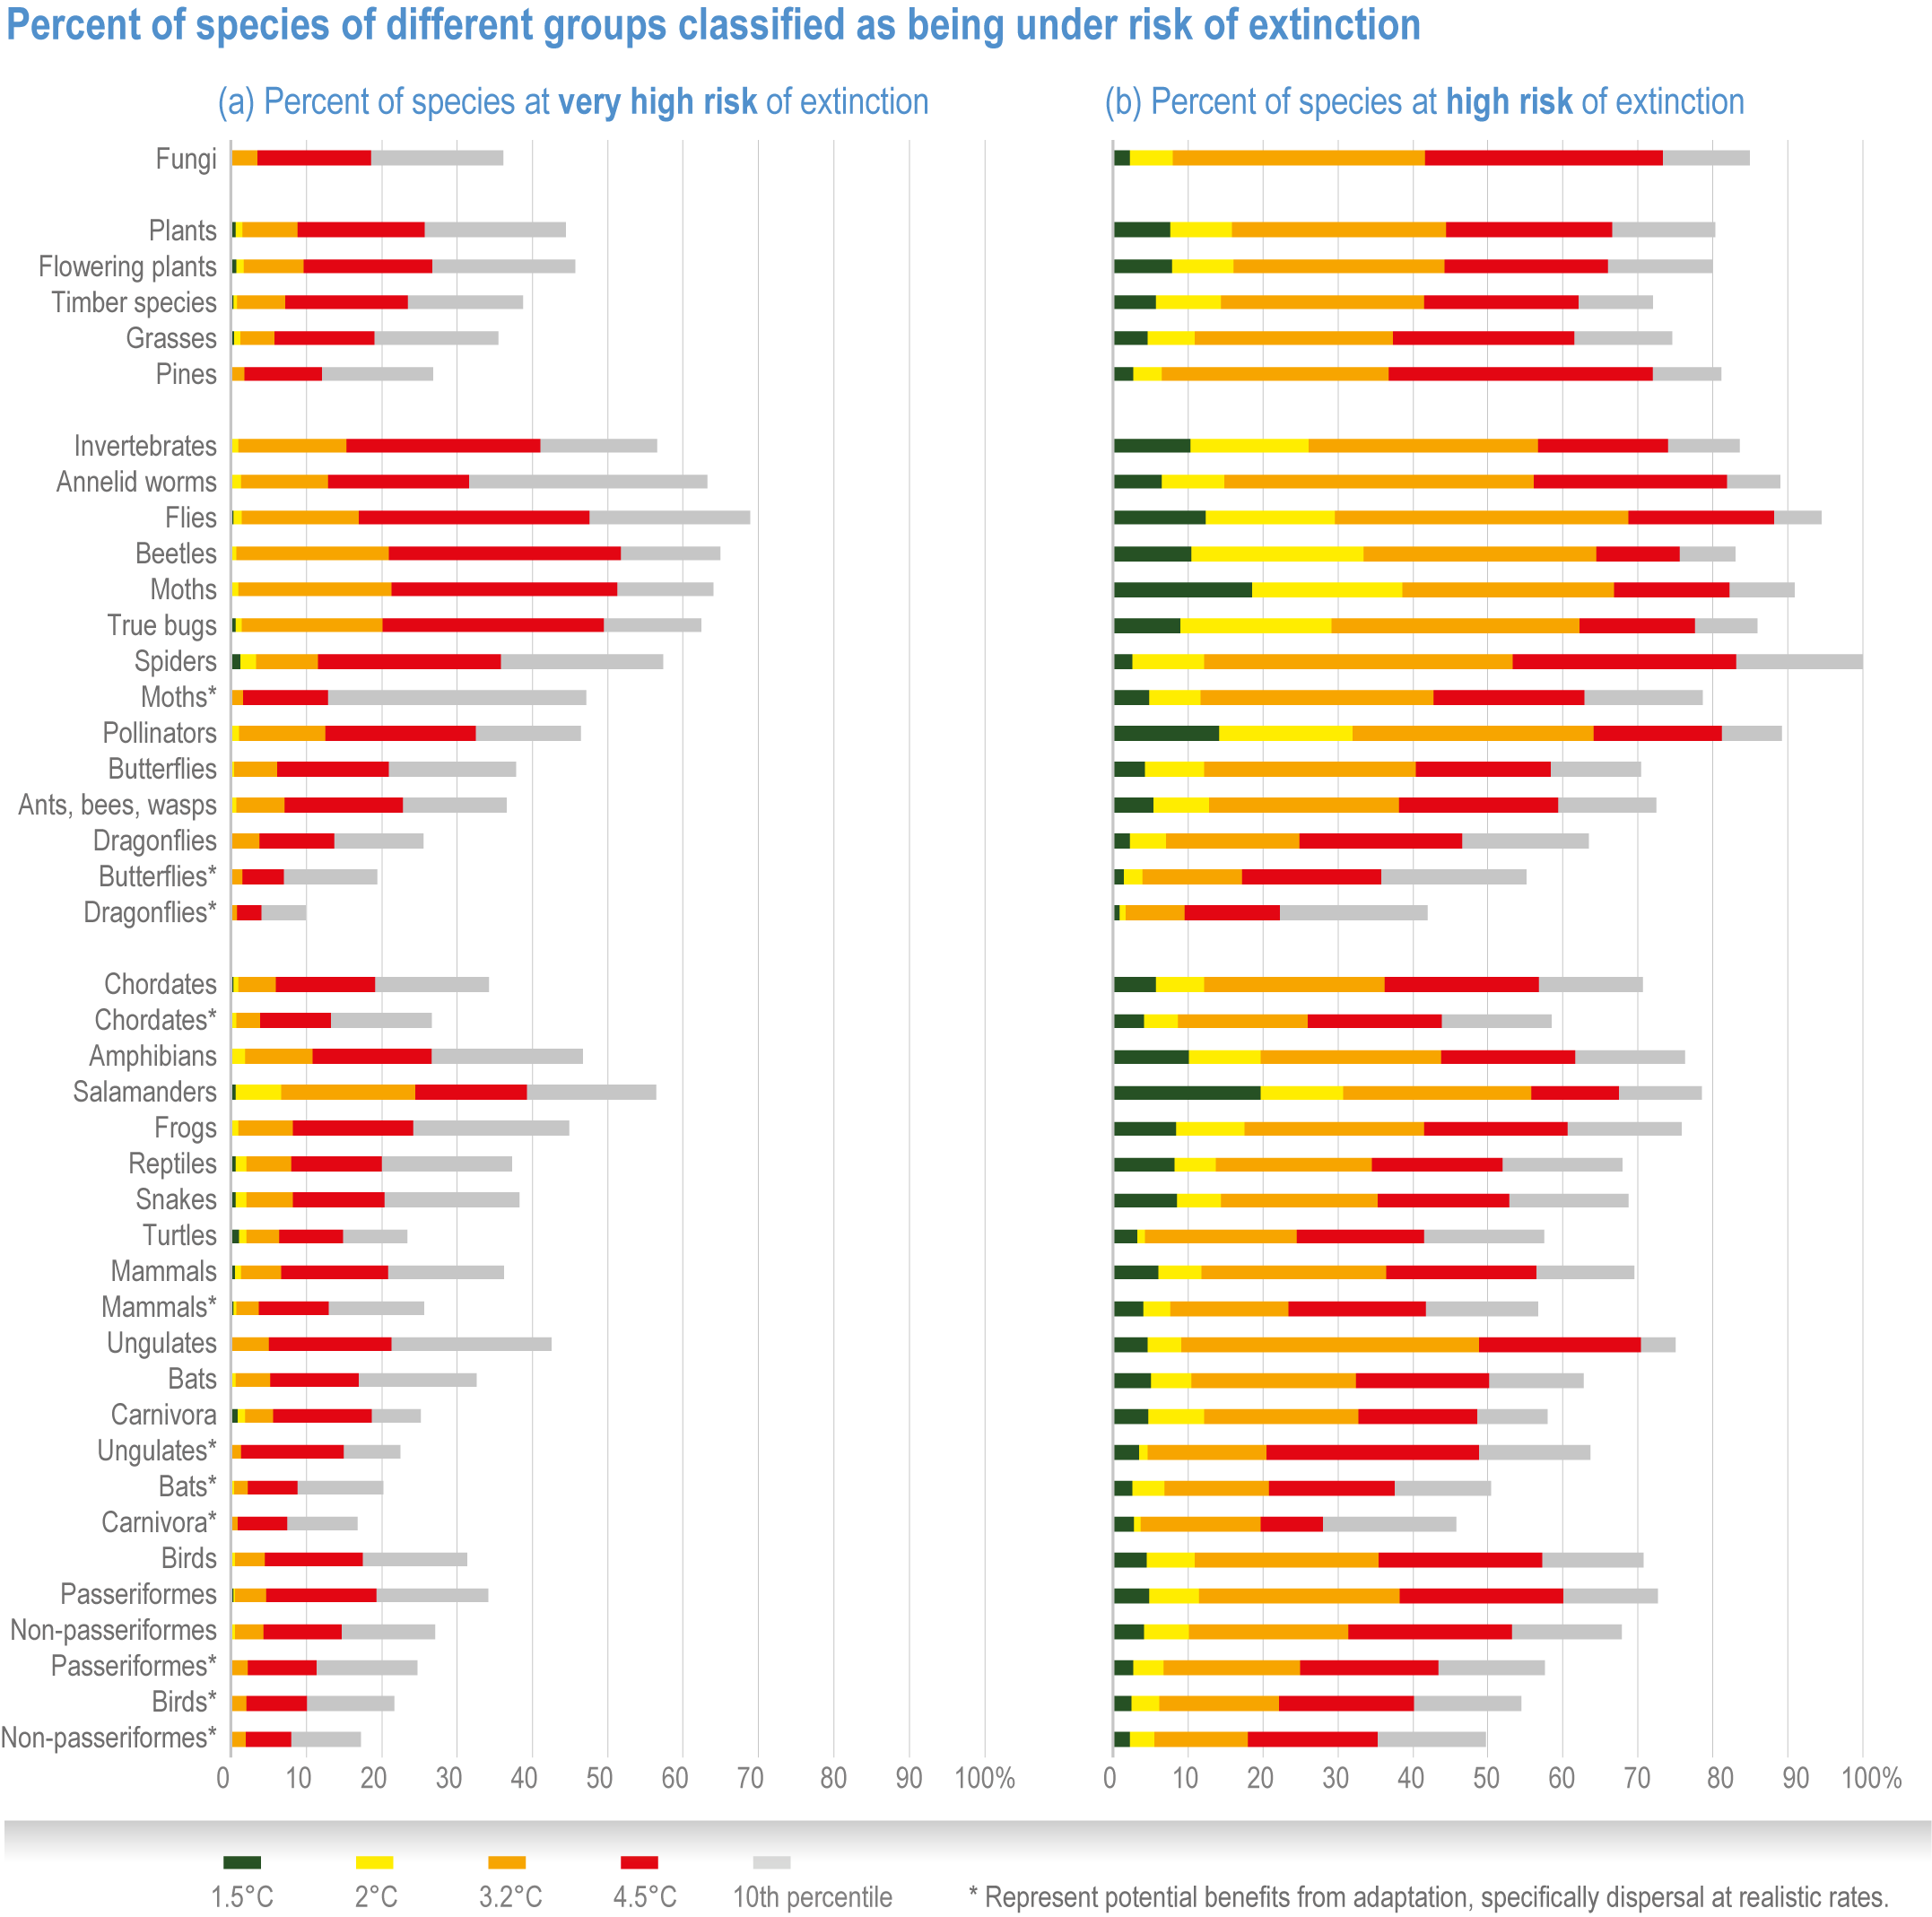
Figure caption
Figure 2.8 | Percent of species of different groups classified as being at risk of extinction.
(a) Species groups listed projected to be at a very highrisk of extinction, corresponding to the IUCN Red List criteria for a species classified as ‘critically endangered’ (v3.1) by losing >80% of its climatically suitable range area.
(b) Species groups listed projected to be at a highrisk of extinction, corresponding to the IUCN Red List criteria for a species classified as ‘endangered’ (v3.1) by losing >50% of its climatically suitable range area. For (a) and (b), values were calculated from the underlying data in (Warren et al., 2018). Values for each temperature are the mean values across 21 CMIP5 models. The grey band represents the high end of extinction risk from the 10th percentile of the climate models to show the maximum range of values, while the low end (90th percentile, 1.5°C) is not shown as it is too small to appear on the plots. Taxa marked with * represent potential benefits from adaptation, specifically dispersal at realistic rates (Warren et al., 2018); those with no * have dispersal rates that are essentially not detected in the spatial resolution of the models (20 km). See (Warren et al., 2018) for caveats and more details. Sample size for each group is as follows: 1) fungi (16187 species); 2) all plants (72399 species), broken down into sub-groups of plants: flowering plants (52310 species), timber species (1328 species), grasses (3389 species) and pines (340 species); 3) all invertebrates (33,949 species), broken down into sub-groups of invertebrates: annelid worms (155 species), flies (4809 species), beetles (7630 species), moths (6910 species), true bugs (1728 species), spiders (2212 species), all pollinators (1755 species), butterflies (1684 species), ants/bees/wasps (5914 species), dragonflies (599 species); 4) Chordates (12642 species), broken down into major groups: 4i) all amphibians (1055 species), broken down into sub-groups of amphibians: frogs (887 species) and salamanders (163 species); 4ii) reptiles (1850 species), snakes (1741 species) and turtles (94 species); 4iii) all mammals (1769 species), broken down into sub-groups of mammals: ungulates (80 species), bats (500 species), carnivores (107 species), 4iv) all birds (7968 species), broken down into sub-groups of birds: passeriforme birds (4744 species), and non-passeriforme birds (3224 species).